Download
1 / 30
340 likes | 570 Vues
Evidence for Evolution. Chapter 2. Evidence of change through time: Living species. Soapberry bugs Vestigial structures “Vestigial” genes (pseudogenes). Evolution of beak length in soapberry bugs – microevolution. Native to southern US In Florida, native host plant is balloon vine

E N D
Evidence for Evolution Chapter 2
Evidence of change through time:Living species • Soapberry bugs • Vestigial structures • “Vestigial” genes (pseudogenes)
Evolution of beak length in soapberry bugs – microevolution • Native to southern US • In Florida, native host plant is balloon vine • which occurs primarily on southern tip of Florida, on the Florida Keys, and less commonly, in central Florida • Bugs feed by piercing the fruit with beak and inserting it into the seeds • Flat-podded golden rain tree introduced to central Florida in 1926 • Rain tree fruit are much thinner than balloon vine fruit
Evolution of beak length in soapberry bugs – microevolution • Soapberry bugs in c. Florida started using rain trees as a host plant • Populations of bugs living on thin-fruited rain trees evolved shorter beaks
More on soapberry bugs – 1 • Beak length is a variable quantitative phenotype (also heritable) • Phenotypic distributions on the two host plant species overlap • But some bugs found on rain trees have much shorter beaks than any bugs found on balloon vines (and vice versa) • Evolution of mean phenotype and the range of the phenotype • “Standing” heritable variation enables populations to make evolutionary responses to changing environments (don’t have to wait for the “right” mutations)
More on soapberry bugs – 2 • How do we know that this is really an evolutionary change, rather than simply a plastic growth response? • Why does natural selection favor shorter beaks in populations that use rain trees as hosts? • a long-beaked bug can exploit both thick and thin fruit • See “Exploring the Literature” #11 at the end of this chapter • This appears to be an example of relatively modest morphological change (microevolution), but could this also be an example of speciation in progress?
Vestigial structures are evidence for evolution • Reduced wings in flightless birds (e.g., kiwi) • Reduced or missing eyes in cave organisms (e.g., Mexican tetras) • Eye development can be stimulated by transplantation of lens tissue from an eyed relative • Vestigial digits during embyronic development in chickens • Pelvises without hind limbs in whales
Molecular vestiges – pseudogenes • Pseudogenes – non-functional DNA sequences that share similarity with functional genes • Arise through gene duplication followed by accumulation of mutations that cause one copy to become non-functional • Example: a-globin gene and ya-globin • members of the globin gene family
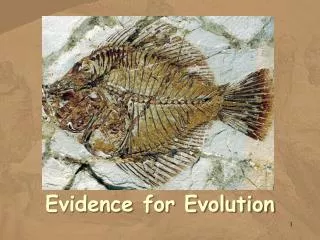
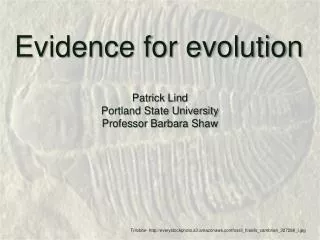
Evidence of change through time:The fossil record • Extinction • Appearance of new forms in the fossil record – “Law of Succession” • glyptodonts and armadillos in S. America • Diprotodon and wombats in Australia • Transitional forms • Archaeopteryx
Archaeopteryx fossil – 19th Cent. Engravings of the London specimen http://www.geo.ucalgary.ca/~macrae/t_origins/archaeopteryx/ http://www.talkorigins.org/faqs/archaeopteryx/info.html
Archaeopteryxvs. modern birdswww.geologyrocks.co.uk/ tut.php?id=13
Evidence of common ancestry – Homology • Originally, and literally, the study of likeness • Similarities among species that are not the result of functional necessity • Example: the tetrapod forelimb
Homology is explained by common ancestry • Darwin argued that homologous similarities were the result of inheritance from common ancestors — humans, moles, horses, dolphins and bats share similar limb skeletons because they all inherited their limbs from a common ancestor with a similar number and arrangement of bones
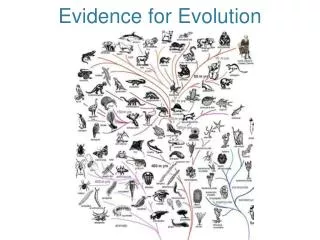
“Tree Thinking” • If: • New species come from already existing species • Some species go extinct without leaving descendants • The total number of species does not decline over time • Then: • Some species must leave two or more descendants • And, the history of life is a branching process that results in an evolutionary tree that describes relationships among species
More Tree Thinking • Evolutionary trees define related groups of species in a nested hierarchy (more closely or more distantly related) • Darwin realized that our ability to erect a hierarchical classification system (e.g., genus, family, order, class) was a direct consequence of branching evolution and common ancestry
A phylogeny (evolutionary tree) is an hypothesis about relationships • In the cat example, no one was around to see it happen • Other investigators reach different conclusions about the details (e.g., lions and tigers are each other’s closest relative = sister taxa)
Molecular homology – processed pseudogenes • Processed pseudogenes are pseudogenes that lack the introns and promoter regions found in their functional equivalents • Thought to result from reverse transcription of processed mRNA • The age of pseudogenes can be estimated by comparing the their nucleotide sequences to those of their functional partners (more differences = more time) • In any phylogeny, pseudogenes that arose more recently (i.e., younger) will be shared by fewer taxa than older pseudogenes
Fig. 2.17(a) Processed pseudogenes used to test Darwin’s hypothesis of common ancestry
Fig. 2.17(b) Processed pseudogenes used to test Darwin’s hypothesis of common ancestry
Fig. 2.17(c) Processed pseudogenes used to test Darwin’s hypothesis of common ancestry
Radiometric dating – 1 • Radioactive isotopes decay at known rates (= half-life) • Relative amounts of parent and daughter isotopes in a rock sample indicate the age of the rock • Important assumptions: • Amount of daughter isotope at time rock was formed is known • Parent and daughter isotopes have not entered or left rock since its formation
Radiometric dating – 2 • http://www.earthsci.unimelb.edu.au/Thomas/lteng/engeimg/enge0507a.GIF • See Table 2.1 of Freeman and Herron (p. 61)