Download
1 / 1
10 likes | 123 Vues
position. time. Using Motion Probes to Enhance Student Understanding of Position vs Time Graphs. Jefferson Hartman College of Education, Touro University - California. Results

E N D
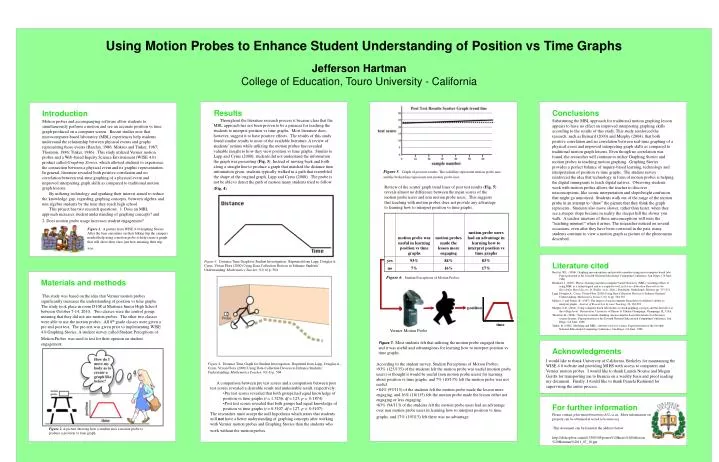
position time Using Motion Probes to Enhance Student Understanding of Position vs Time Graphs Jefferson HartmanCollege of Education, Touro University - California • Results • Throughout the literature research process it became clear that the MBL approach has not been proven to be a panacea for teaching the students to interpret position vs time graphs. Most literature does, however, suggest it to have positive effects. The results of this study found similar results to most of the available literature. A review of students’ actions while utilizing the motion probes has revealed valuable insight to how they view position vs time graphs. Similar to Lapp and Cyrus (2000), students did not understand the information the graph was presenting (Fig. 3). Instead of moving back and forth along a straight line to produce a graph that matched the distance time information given, students typically walked in a path that resembled the shape of the original graph, Lapp and Cyrus (2000). The probe is not be able to detect the path of motion many students tried to follow (Fig. 4) Conclusions Substituting the MBL approach for traditional motion graphing lesson appears to have no effect on improved interpreting graphing skills according to the results of this study. This study reinforced the research, such as Bernard (2003) and Murphy (2004), that both positive correlation and no correlation between real-time graphing of a physical event and improved interpreting graph skills as compared to traditional motion graph lessons. Even though no correlation was found, the researcher will continue to utilize Graphing Stories and motion probes to teaching motion graphing. Graphing Stories provides a perfect balance of inquiry-based learning, technology and interpretation of position vs time graphs. The student survey reinforced the idea that technology in form of motion probes is helping thedigital immigrants to teach digital natives. Observing students work with motion probes allows the teacher to discover misconceptions, like iconic interpretation and slope/height confusion that might go unnoticed. Students walk out of the range of the motion probe in an attempt to “draw” the picture that they think the graph represents. Students also move slower, rather than faster, when they see a steeper slope because in reality the steeper hill the slower you walk. A teacher unaware of these misconceptions will miss the “teaching moment” when it arises. The researcher noticed on several occasions, even after they have been corrected in the past, many students continue to view a motion graph as picture of the phenomena described. • Introduction • Motion probes and accompanying software allow students to simultaneously perform a motion and see an accurate position vs time graph produced on a computer screen. Recent studies note that microcomputer-based laboratory (MBL) experiences help students understand the relationship between physical events and graphs representing those events (Barclay, 1986; Mokros and Tinker, 1987; Thornton, 1986; Tinker, 1986). This study utilized Vernier motion probes and a Web-based Inquiry Science Environment (WISE 4.0) product called Graphing Stories, which allowed students to experience the connection between a physical event and its graphic representation. In general, literature revealed both positive correlation and no correlation between real-time graphing of a physical event and improved interpreting graph skills as compared to traditional motion graph lessons. • By utilizing technology and sparking their interest aimed to reduce the knowledge gap, regarding graphing concepts, between algebra and non algebra students by the time they reach high school. • This project has two research questions: 1. Does an MBL approach increases student understanding of graphing concepts? and • 2. Does motion probe usage increases student engagement? Figure 5.Graph of post test results. The solid line represents motion probe user and the broken line represents non motion probe user. Review of the scatter graph trend lines of post test results (Fig. 5) reveals almost no difference between the mean scores of the motion probe users and non motion probe users. This suggests that teaching with motion probes does not provide any advantage to learning how to interpret position vs time graphs. Figure 1. A picture from WISE 4.0 Graphing Stories. After the bear encounter on their hiking trip the campers needed help using a motion probe to help create a graph that will show their class just how amazing their trip was. Literature cited Barclay, W.L. (1986). Graphing misconceptions and possible remedies using microcomputer-based labs. Paper presented at the Seventh National Educational Computing Conference, San Diego, CA June, 1986. Bernhard, J. (2003). Physics learning and microcomputer based laboratory (MBL): Learning effects of using MBL as a technological and as a cognitive tool, in Science Education Research in the KnowledgeBased Society, D. Psillos, et al., (Eds.), Dordrecht, Netherlands: Kluwer, pp. 313-321. Lapp, Douglas A., Cyrus, Vivian Flora (2000) Using Data-Collection Devices to Enhance Students’ Understanding. Mathematics Teacher, 93( 6) pp. 504-510 Mokros, J. and Tinker, R. (1987). The impact of microcomputer-based labs on children’s ability to interpret graphs. Journal of Research in Science Teaching, 24, 369-383. Murphy, L.D. (2004). Using computer-based laboratories to teach graphing concepts and the derivative at the college level. Dissertation. University of Illinois at Urbana-Champaign, Champaign, IL, USA Thornton, R. (1986). Tools for scientific thinking: microcomputer-based laboratories for the naive science learner. Paper presented at the Seventh National Educational Computing Conference, San Diego, CA June, 1986. Tinker, R. (1986). Modeling and MBL: software tools for science. Paper presented at the Seventh National Educational Computing Conference, San Diego, CA June, 1986. Figure 3. Distance Time Graph for Student Investigation. Reprinted from Lapp, Douglas A., Cyrus, Vivian Flora (2000) Using Data-Collection Devices to Enhance Students’ Understanding. Mathematics Teacher, 93( 6) p. 504 Materials and methods This study was based on the idea that Vernier motion probes significantly increases the understanding of position vs time graphs. The study took place in room D108 at Martinez Junior High School between October 7-14, 2010. Two classes were the control group; meaning that they did not use motion probes. The other two classes were able to use the motion probes. All 8th grade classes were given a pre and post test. The pre-test was given prior to implementing WISE 4.0 Graphing Stories. A student survey called Student Perceptions of Motion Probeswas used to test for their opinion on student engagement. Figure 6.Student Perceptions of Motion Probes. Vernier Motion Probe Figure 7.Most students felt that utilizing the motion probe engaged them and it was useful and advantageous for learning how to interpret position vs time graphs. Acknowledgments I would like to thank University of California, Berkeley for maintaining the WISE 4.0 website and providing MJHS with access to computers and Vernier motion probes. I would like to thank Lauren Nourse and Megan Gerdts for transporting me to Benicia on a weekly basis and proof reading my document. Finally, I would like to thank Pamela Redmond for supervising the entire process. • According to the student survey, Student Perceptions of Motion Probes: • 93% (125/135) of the students felt the motion probe was useful (motion probe users) or thought it would be useful (non motion probe users) for learning about position vs time graphs, and 7% (10/135) felt the motion probe was not useful. • 84% (97/115) of the students felt the motion probe made the lesson more engaging, and 16% (18/115) felt the motion probe made the lesson either not engaging or less engaging. • 83% (94/113) of the students felt the motion probe users had an advantage over non motion probe users in learning how to interpret position vs time graphs, and 17% (19/113) felt there was no advantage. Figure 4. Distance Time Graph for Student Investigation. Reprinted from Lapp, Douglas A., Cyrus, Vivian Flora (2000) Using Data-Collection Devices to Enhance Students’ Understanding. Mathematics Teacher, 93( 6) p. 504 • A comparison between pre test scores and a comparison between post test scores revealed a desirable result and undesirable result, respectively: • Pre test scores revealed that both groups had equal knowledge of position vs time graphs (t = 1.3256, df = 123, p = 0.1874) • Post test scores revealed that both groups had equal knowledge of position vs time graphs (t = 0.5107, df = 127, p = 0.5107) • The researcher must accept the null hypothesis which states that students will not have a better understanding of graphing concepts after working with Vernier motion probes and Graphing Storiesthan the students who work without the motion probes. For further information Please contact jehartman@martinez.k12.ca.us. More information on this and related projects can be obtained at wise4.telscenter.org This document can be found at the address below Figure 2. A picture showing how a student uses a motion probe to produce a position vs time graph. http://dl.dropbox.com/u/13300305/poster%20thesis%20Jefferson%20Hartman%2011_07_10.ppt