Download

1 / 52
520 likes | 649 Vues
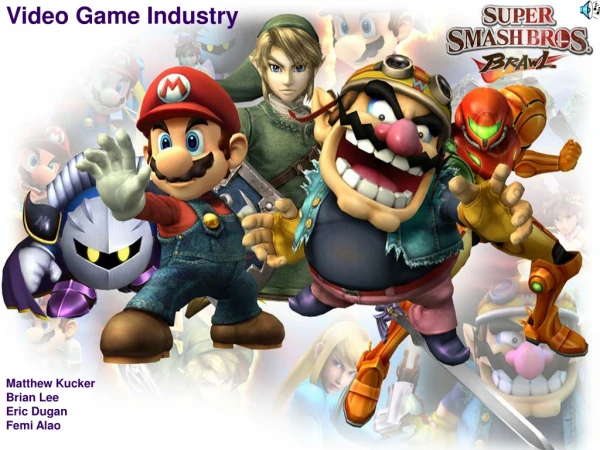
Presented By Tony Morelli. Video Game Industry modeled by complex networks. Outline. Intro/Problem Description Summary Visual Network Representations Numerical Network Representations Questions/Comments. INTRO. Has the organization of the video game industry changed in the last 20 years?

E N D
Presented By Tony Morelli Video Game Industry modeled by complex networks
Outline • Intro/Problem Description Summary • Visual Network Representations • Numerical Network Representations • Questions/Comments
INTRO • Has the organization of the video game industry changed in the last 20 years? • Consoles • Game Titles • Producers • Developers
INTRO • Related Work Showed • Graphical Analysis is good • Both Colors and Size are important
INTRO • Related Work Showed • Numerical Analysis is Good • Clustering Coefficient • Degree Distribution • Expansion
Network Topologies, Power Laws, and Hierarchy • Analyzed internet topology generators • Metrics • Expansion • “The average fraction of nodes in the graph that fall within a ball of radius r, centered at a node in the topology
Comparison of Translations • How accurate are software based translators? • Portuguese->Spanish->English • Clustering Coefficient, Out Degree
Consoles to Analyze • Group A – Classic Consoles • Atari 2600 (1977) • Nintendo Entertainment System (1983) • Sega Master System (1985)
Consoles to Analyze • Group B – Current Consoles • XBOX 360 (2005) • Playstation 3 (2006) • Nintendo Wii (2006)
Problem • Not evaluating enough consoles • Suggestion – Evaluate all consoles from Atari 2600 and forward
Enhanced problem • Still want to organize by generations • Need to group all consoles by generation
Generation 1 • Atari 2600 • Nintendo Entertainment System • Sega Master System
Generation 2 • Super Nintendo (1990)
Generation 2 • Super Nintendo (1990) • Turbo Grafx 16 (1989)
Generation 2 • Super Nintendo (1990) • Turbo Grafx 16 (1989) • Sega Genesis (1989)
Generation 3 • N64 (1996)
Generation 3 • N64 (1996) • Playstation (1994)
Generation 3 • N64 (1996) • Playstation (1994) • Sega Saturn (1995)
Generation 4 • GameCube (2001)
Generation 4 • GameCube (2001) • Xbox (2001)
Generation 4 • GameCube (2001) • Xbox (2001) • Playstation 2 (2000)
Generation 5 • Playstation 3 • Xbox 360 • Nintendo Wii
Suggestions not used • Total Sales for each title • Data is not available • Cross development • Developers/publishers that work on multiple platforms • My goal is to average statistics for each generation separately. • Data is not consistent in naming conventions • Would need to do a lot of editing by hand
How to analyze video game networks? • Collect Data • Use Software Tools • Create Tools where existing tools are not good enough • Present the data
Data Collection • Need to obtain • Title • Console • Publisher • Developer • Data is not centrally available • Spread out across the internet
Data Collection • Need to write a custom scraper to get data • Video Game Grabber (VG2) • Written in C#
Data Collection • VG2 Code • Need to get data into a csv • Easy for importing into other tools • Title,Developer,Publisher • Console is in the file name
Data Collection • VG2 Code • C# provides a nice interface • HttpWebRequest request = (HttpWebRequest)HttpWebRequest.Create (www.yahoo.com); • HttpRebResponseresp = (HttpWebResponse)request.GetResponse(); • StreamReadersr = new StreamReader(resp.GetResponseStream()); • string source = sr.ReadToEnd();
Data Collection • VG2 Code • Using the previous calls • Data retrieved • Or links followed to find the data • Custom functions were written based on which website the data was pulled from
Data Collection • VG2 Code
Data Collection • VG2Code • Error detection • Any links that could not be followed • Any data that could not be retrieved • Recorded as ERROR into the csv file • These were looked at by hand and either removed or adjusted. • Common errors where when the publisher was different for different regions • NA publisher was used in these cases
Data Collection • VG2 Code • Convert csv.net • Pajek Format • Sample: *Vertices 1123 1 "PS3" 2 "100 Bullets" 3 ”Silicon Studio" 4 "D3 Publisher" 5 "2010 FIFA World Cup South Africa" 6 "EA Canada" 7 "EA Sports" 8 "3D Dot Game Heroes"
Data Collection • VG2 Code • Convert csv .gdf • GUESS Format • Sample: nodedef> name PS3 100_Bullets Silcon_Studio D3_Publisher 2010_FIFA_World_Cup_South_Africa EA_Canada EA_Sports 3D_Dot_Game_Heroes
Data Collection • Current Status • All consoles have data in csv,.net, and .gdf • Except Sega Saturn • Data seems incomplete • Might assemble data from multiple sites • Might replace with Dreamcast • Might just throw it out
Data Analysis • Now that the data is in the correct formats • Numerical Analysis • Graphical Analysis
Numerical Analysis • Clustering Coefficient • How to do this with Pajek • Net->Vector->Clustering Coefficient->CC1
Numerical Analysis • Degree Distribution • How to do this with Pajek • Net->Partitions->Degree->Output
Numerical Analysis • Expansion • How to do this with custom software • Want to know what percentage of nodes are at each level in the hierarchy • Percentage of total nodes that are • Titles • Developers • Publishers
What to do with the numbers • Create a plot and produce a trend line • Average each of the 3 metrics for each generation • Clustering Coefficient • Degree Distribution • Expansion (3 separate averages) • Plot the average of each of the 5 generations
Graphical Analysis • Colors • How to do this with Pajek • Net->Partitions->Degree->Output • Draw->Partition
Graphical Analysis • Colors • How to do this with Pajek • Layout->Energy->Kamada-Kawai->Separate Components
Graphical Analysis • Size • How to do this with GUESS
Graphical Analysis • Size • How to do this with GUESS • g.nodes.outdegree • resizeLinear(outdegree,1,75) • Layout->Physics
Data Analysis • Create animations from all the data • 3 Consoles from 5 Generations
Data Analysis • Average all numerical results for each generation • Show a graph with a trend line for each metric