Download
1 / 27
270 likes | 422 Vues
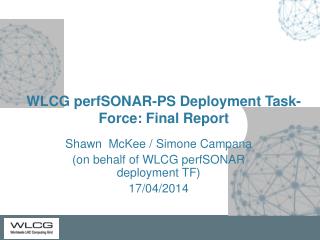
perfSONAR -PS Update. Shawn McKee/University of Michigan WLCG PS Deployment TF Co-chair GDB Meeting CERN February 12 th , 2014. Vision for perfSONAR -PS in WLCG. Goals: Find and isolate “network” problems; alerting in a timely way Characterize network use (base-lining)

E N D
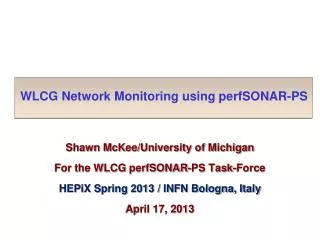
perfSONAR-PS Update Shawn McKee/University of Michigan WLCG PS Deployment TF Co-chair GDB Meeting CERN February 12th, 2014
Vision for perfSONAR-PS in WLCG • Goals: • Find and isolate “network” problems; alerting in a timely way • Characterize network use (base-lining) • Provide a source of network metrics for higher level services • First step: get monitoring in place to create a baseline of the current situation between sites (see details later) • Next: continuing measurements to track the network, alerting on problems as they develop • Choice of a standard “tool/framework”: perfSONAR • We wanted to benefit from the R&E community consensus • perfSONAR’s purpose is to aid in network diagnosis by allowing users to characterize and isolate problems. It provides measurements of network performance metrics over time as well as “on-demand” tests. GDB/CERN
Plans for WLCG Operations • WLCG (Worldwide LHC Computing Grid) operations task-force for perfSONAR: • Encouraging all sites to deploy and register two instances • All sites to use the “mesh” configuration • One set of test parameters to be used everywhere • Detailed instructions at https://twiki.cern.ch/twiki/bin/view/LCG/PerfsonarDeployment • Simone presented at CHEP 2013 bringing perfSONAR-PS to an international audience • The current dashboard is a central source for network information. We also need to make sure we are gathering the right metrics and making them easily accessible • We need to encourage discussion about the types of metrics our frameworks and applications would like concerning the network GDB/CERN
Summary: Where Are We? • Newest release 3.3.2 of perfSONAR-PS released February 3, 2014. Improvements in security, minor bugfixes, improvements • Modular Dashboard project now “orphaned”. Code still in GitHubhttps://github.com/PerfModDash/PerfModDash • New prototype replacement of Modular Dashboard under evaluation (Uses OMD http://omdistro.org/start and MaDDash) • Tickets issued for perfSONAR-PS issues (see below) • About 85% of WLCG sites have perfSONAR-PS (at some level) • 15% are problematic and may need intervention from the experiments • Of the 85% with perfSONAR-PS we have some issues to resolve for a significant fraction: • Firewalls are blocking services • Sites are not using the mesh-configuration • Versions are too old or not fully configured • Nodes are down/crashed GDB/CERN
Old Modular Dashboard (Orphaned) https://github.com/PerfModDash/PerfModDash GDB/CERN
Modular Dashboard Replacement MaDDash (Monitoring and Debugging Dashboard) is a perfSONAR-PS project developed and maintained by ESnet. It is easy to install, provides drill-down capability and will be supported for the foreseeable future. (Install details at https://twiki.cern.ch/twiki/bin/view/LCG/MadDashWLCG ) It doesn’t provide any primitive service monitoring nor the ability to create/edit meshes via the GUI. GDB/CERN
Example Throughput Mesh Colors denote defined ranges of throughput (using default from ESnet for now) Hovering provides results from both Measurement Archives(MAs) involved in the test Clicking allows you to drill down GDB/CERN
MaDDash Drill-down to Graphs GDB/CERN
OMD Description and Capabilities • OMD (Open Monitoring Distribution) was selected to complement MaDDash and replicate the service testing component present in the Modular Dashboard. • OMD bundles Nagios/Icinga/Shinken with various tools in a single RPM. Easy to deploy and configure; provides nice features. • For those familiar with Nagiosthere is a low barrier to use. • The Check_MK (rule-based configuration) is a very powerful component we can leverage. • Installation via yum by : ‘yum install omd-1.10’ (once repo setup) • Currently prototype for WLCG evaluation is running at: https://maddash.aglt2.org/WLCGperfSONAR/omd GDB/CERN
WLCG OMD Check_MKMainpage GDB/CERN
Grouping By Hosts Check_MK rules were used to setup host groups Easy to track Regional/VO cloud status this way Can also organize by perfSONAR node type The “Name” column is a link you can use to drill-down to host lists GDB/CERN
Grouping By Service We can also group by service type, allowing us to quickly check service status by grouping. Name column is clickable. Note we check needed PS services but don’t yet have a good check of sites mesh-configuration (use dashboard for now) GDB/CERN
Example of Detailed Host Monitoring Individual hosts can be monitored in detail by installing check_mk-agents See https://twiki.cern.ch/twiki/bin/view/LCG/WLCGperfSONARMonitoring GDB/CERN
Feature: Graphs Automatically Created Graphs are created automatically where checks provide performance data. Hovering over the “graph” icon shows a thumbnail. Clicking takes you to a page will larger graphs sequenced by timescale (RRD). GDB/CERN
Mesh-Config Comments and Status • One of the lessons learned from LHC use of perfSONAR-PS was that setting up and maintaining scheduled tests for the perfSONAR-PS toolkit instances was a challenge. • As sites changed, joined or left, every other site needed to update their configuration to change, add or remove tests. • Labor intensive, slow to get all updates in place and gets worse as we increase the size of the deployments! • Aaron Brown/Internet2 provided a solution: the “mesh” configuration which allows sites to track a central configuration and update themselves when it changes: http://www.usatlas.bnl.gov/twiki/bin/view/Projects/PerfSONAR_PS_Mesh • perfSONAR-PS 3.3.x has all functionality for the mesh built-in • We plan to automate the generation of the required WLCG meshes using OIM/GOCDB registration + some “metadata” GDB/CERN
perfSONAR-PS Mesh Example perfSONAR-PS toolkit instances can get their configuration information from a URL hosting an suitable JSON file An agent_configuration file on the PS node defines one or more URLs The perfSONAR-PS instances can participate in more than one configuration (WLCG, Tier-1 cloud, VO-based, etc.) + manually added tests. The WLCG mesh configurations are centrally hosted at CERN and exposed through HTTP https://grid-deployment.web.cern.ch/grid-deployment/wlcg-ops/perfsonar/conf/central/ GDB/CERN
WLCG Deployment Details • Sites are organized in regions • Based on geographical locations and experiments computing models • All sites are expected to deploy a bandwidth host and a latency host • Regular testing is setup using a set of centralized (“mesh”) configurations • Bandwidth tests: 30 seconds tests • every 6 hours intra-region, 12 hours for T2-T1 inter-region, 1 week elsewhere • Latency tests; 10 Hz of packets to each WLCG site • Traceroute tests between all WLCG sites each hour • Ping(ER) tests between all site every 20 minutes GDB/CERN
Using perfSONAR-PS Metrics • Throughput: Notice problems and debug network, also help differentiate server problems from path problems • Latency: Notice route changes, asymmetric routes • Watch for excessive Packet Loss • On-demand tests and NPAD/NDT diagnostics via web • Optionally: Install additional perfSONAR nodes inside local network, and/or at periphery • Characterize local performance and internal packet loss • Separate WAN performance from internal performance • Daily Dashboard check of own site, and important peers GDB/CERN
Debugging Network Problems • Using perfSONAR-PS we (the VOs) identify network problems by observing degradation in regular metrics for a particular “path” • Packet-loss appearance in Latency tests • Significant and persistent decrease in bandwidth • Currently requires a “human” to trigger. • Next check for correlation with other metric changes between sites at either end and other sites (is the problem likely at one of the ends or in the middle?) • Correlate with paths and traceroute information. Something changed in the routing? Known issue in the path? • In general NOT as easy to do all this as we would like even with the current perfSONAR-PS toolkit GDB/CERN
Network Monitoring Challenges • Getting hardware/software platform installed at allWLCG sites • Dashboard development: Need additional effort to produce something suitable quickly and ensure it meets our needs… • Managing site and test configurations • Testing and improving “centralized” (VO-based?) configurations • Verifying the right level of scheduled tests for a site, e.g., Tier-2s test to other same-cloud Tier-2s (and Tier-1)? • Address 10G vs 1G tests that give misleading results • Improve path monitoring (traceroute) access within the tool • Alerting: A high-priority need but complicated: • Alert who? Network issues could arise in any part of end-to-end path • Alert when? Defining criteria for alert threshold. Primitive services are easier. Network test results more complicated to decide • Integration with VO infrastructures and applications (ongoing) GDB/CERN
Improving perfSONAR-PS Deployments • Based upon the issues we have encountered we setup a Wiki to gather best practices and solutions to issues we have identified: http://www.usatlas.bnl.gov/twiki/bin/view/Projects/LHCperfSONAR • This page is shared with the perfSONAR-PS developers and we expect “fixes” will be incorporated into future releases (current list already addressed in v3.3.2) • Improving resiliency (set-it-and-forget-it) a high priority. Instances should self-maintain and the infrastructure should be able to alert when services fail (OMD tests) • Disentangling problems with the measurement infrastructure versus problems with the measurements… • PS Roadmap at https://code.google.com/p/perfsonar-ps/wiki/RoadMap GDB/CERN
My perfSONAR-PS Wishlist • Continued reliability/resiliency improvements • Must be “set-it-and-forget-it” to meet the needs of the bulk of our users • Topology/path diagnosis support • Traceroute sensitive to ECMP (“Paris” traceroute) • Tools/gui to: • visualize route • show router port usage • show drops/errors • Identify perfSONAR-PS instances alongthe path • Path comparison/correlation tools using metrics coupled +traceroutes (identify “bad” paths via multiple measurements) • Alerting and alarming • Support for configuring notification to alert users to network problems • NAGIOS support exists but not well matched to multidomain issues • Alarms targeted at most likely problem domain • Handle NIC speed mismatches • 10GE testing to 1GE “overruns” and provides misleading information • Support for additional tests (Iperfvariants, new tools, etc) GDB/CERN
Future Use of Network Metrics • Once we have a source of network metrics being acquired we need to understand how best to incorporate those metrics into our facility operations. • Some possibilities: • Characterizing paths with “costs” to better optimize decisions in workflow and data management (underway in ANSE) • Noting when paths change and providing appropriate notification • Optimizing data-access or data-distribution based upon a better understanding of the network between sites • Identifying structural bottlenecks in need of remediation • Aiding network problem diagnosis and speeding repairs • In general, incorporating knowledge of the network into our processes • We will require testing and iteration to better understand when and where the network metrics are useful. GDB/CERN
WLCG perfSONAR Considerations • Getting a WLCG network service with suitable data-store in production in OSG is a high priority • OSG has offered to host a “Network Service” for WLCG • Need to exercise the API and start testing use of metrics • We will need to plan for IPv6 monitoring. As sites move to using IPv6 we have to be ready to test the potentially different paths and performance • Duncan Rand has done some nice work in this direction already. • The test definitions and resulting metrics will need to be evaluated for their effectiveness • Are tests providing useful information? • Are the test parameters optimized for our use-cases? • What are the appropriate OK, WARN and CRIT levels? • Do we need to add new tests/metrics? GDB/CERN
Closing Remarks • perfSONARdashboard is critical for “visibility” into networks. We can’t manage/fix/respond-to problems if we can’t “see” them. • Our assumption is that perfSONAR (and the perfSONAR-PS toolkit) is the de-facto standard way to get network metrics and will be supported long-term • Especially critical that R&E networks agree on its use and continue to improve and develop the reference implementation. This is the case • Having perfSONAR-PS fully deployed should give us some interesting options for better management and use of our networks • Need to get some “network service” operating in OSG for WLCG. GDB/CERN
Discussion/Questions Questions or Comments? GDB/CERN
Relevant URLs • WLCG perfSONAR-PS deployment URL: http://twiki.cern.ch/twiki/bin/view/LCG/PerfsonarDeployment • perfSONAR-PS site http://psps.perfsonar.net/ • perfSONAR-PS Install/configuration guide: http://code.google.com/p/perfsonar-ps/wiki/pSPerformanceToolkit33 • MaDDashDashboard: http://maddash.aglt2.org/maddash-webui • Tools, tips and maintenance: http://www.usatlas.bnl.gov/twiki/bin/view/Projects/LHCperfSONAR • OSG networking pages https://www.opensciencegrid.org/bin/view/Documentation/NetworkingInOSG • OMD prototype for WLCG perfSONAR-PS Monitoring: https://maddash.aglt2.org/WLCGperfSONAR/ GDB/CERN