Download
1 / 14
140 likes | 249 Vues
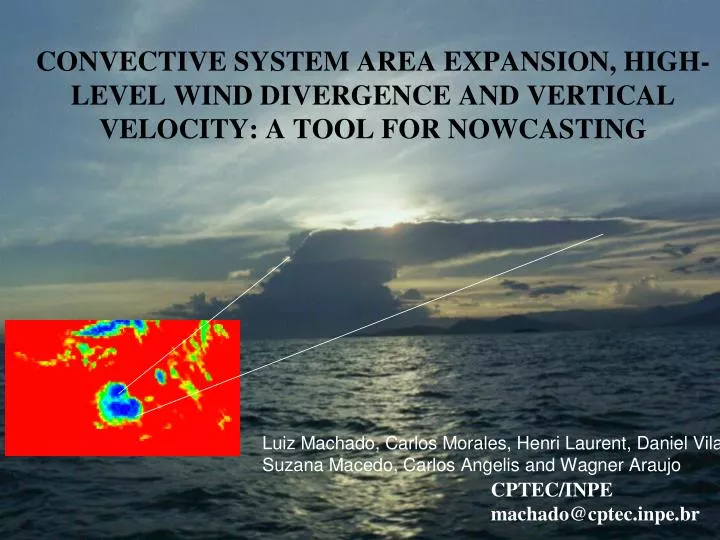
Schematic diagram of the convective system life cycle size evolution. Lifetime= F (A e Initiation ). Mass flux or condensation process in the initiation determines the behavior of the MCS in the next few hours. Upper levels - WV satellite Winds.

E N D
Schematic diagram of the convective system life cycle size evolution Lifetime=F(AeInitiation) Mass flux or condensation process in the initiation determines the behavior of the MCS in the next few hours.
The area time rate depends from the expansion from the wind advection and also by the condensation/evaporation process. The liquid water content of the convective system (Ql) can be described as: ρlis the liquid water density H is the convective system height The top of the convective system, detected using a cold threshold, is close to the tropopause and therefore H variations are relatively small and can be neglected
RADAR – CAPPI – 2 km DrytoWet/LBA When radar high time resolution data is employed, the importance of the term describing ascend/descend rate of the top of clouds should be of first order.
RADAR – CAPPI – 2 km DrytoWet/LBA The area expansion can be used as a proxy to quantify the mass flux or the condensation rate inside the convective system and consequently the W
Reflectivity Profile Variation after 10 minutes for Different Classes of W (20 dBZ)
Conclusions • The area expansion is closely linked to the phase of the convective system’s life. At the beginning of its life the convective system presents a large positive area expansion. The area expansion becomes close to 0 during the mature stage of the system and negative in the dissipation stage. • The results demonstrate the ability to predict the lifetime of a convective system from its initial area expansion. The physical explanation for this result is founded on the principle that this parameter measures the vigor of the convective forcing indicating the time/space scale of the convective cloud organization. • The area increase in the initial stage is mainly due to the condensation process then afterwards, close to the mature stage, it is due to the upper air wind divergence. The upper air divergence is a signature of the mass flux inside the convective towers that had previously contributed to the condensation process. • Large values of cloud top increase are associated with a clear increase of ice phase (ice particles aloft) and surface precipitation in the next 30 minutes. For the situation when the cloud top rapidly decreases, the reflectivity profile, in the next half hour, presents the collapse of the ice phase and a significant decrease of the precipitation. • The rate of cloud top increase can be approximately related to the average vertical velocity of the convective core. The time variations of this variable can also be used as a proxy for the stage, intensity and lifetime duration of the convective activity.