Download
1 / 14
140 likes | 249 Vues
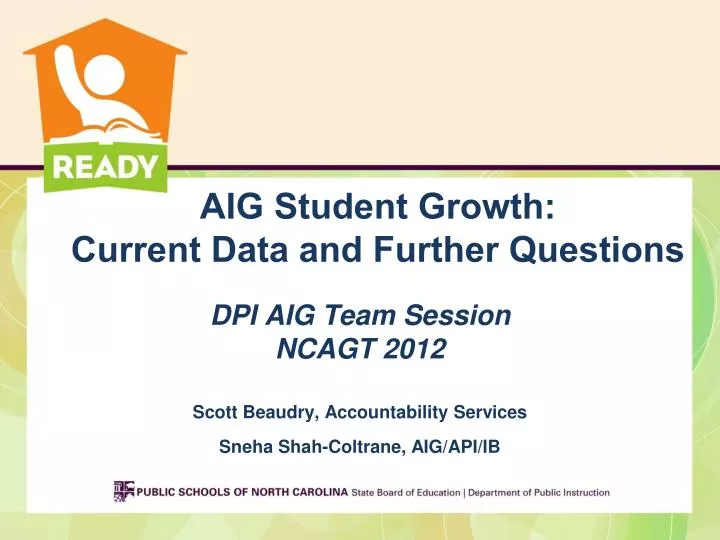
AIG Student Growth: Current Data and Further Questions. DPI AIG Team Session NCAGT 2012 Scott Beaudry, Accountability Services Sneha Shah-Coltrane, AIG/API/IB.

E N D
AIG Student Growth:Current Data and Further Questions DPI AIG Team Session NCAGT 2012 Scott Beaudry, Accountability Services Sneha Shah-Coltrane, AIG/API/IB
In order to leave no child behind and prepare all students for the 21st century, we must focus on AIG learners’ growth. This is critical for both student and school success.
AIG Student Growth: Current State • Some say AIG learners are “being left behind” in the era of high stakes testing; • Not published in NC’s ABC Report Card, counted in general population; • AIG is not part of NCLB, not an AYP sub-group; • Myths surrounding growth, because lack of information.
AIG Student Growth: Current Measures • Student Data • Current model is a based on residuals • Scale scores are standardized using the mean and standard deviation from the standard setting year (C-Score) • Current C-Score is compared to previous C-Scores, the residual is considered growth • EVAAS
Calculation of growth score AC = CSc-scale – (0.92 x ATPAc-scale) Where AC = academic change CS = current score ATPA = average of two previous assessment scores
Notes about the data • 2010-2011 Accountability Year • Not longitudinal, multiple groups, point in time • AIG identification in one subject independent of the other subject
Is there room to grow? • Across subjects and grades, AIG students exceed 95% in proficiency • Average scale scores indicate there is still some room to improve performance • Proficiency and growth are independent measures • Can be proficient and not make growth
Basic AIG Data, State-view • At the state level, AIG results are unsurprising • When examining the results by grade level and test subject, differences begin to emerge • Comparing LEAs to the State presents additional information and differences
Basic AIG Data, State-view • 2005 analysis showed AIG students transition 2.5 times more often than general population to level 4. • Across all tests, >95% of students identified as AIG in Math are proficient, with 62.9% making growth. • For AIG in Reading, >95% are proficient, with 62.7% making growth.
Basic AIG Data: Sample LEA • Across all tests, >95% of students identified as AIG in Math were proficient, with 62.0% making growth. (NC was 62.9%) • For AIG in Reading, >95% were proficient, with 62.2% making growth. (NC was 62.7%)
GOAL: Meaningful and Useable DataWhat does that mean to you?