Download
1 / 49
490 likes | 585 Vues
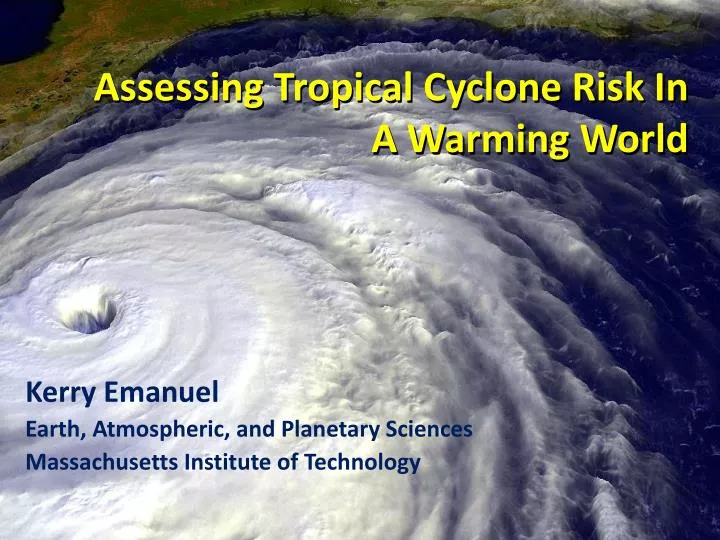
Assessing Tropical Cyclone Risk In A Warming World. Kerry Emanuel Earth, Atmospheric, and Planetary Sciences Massachusetts Institute of Technology. Atlantic Sea Surface Temperatures and Storm Max Power Dissipation (Smoothed with a 1-3-4-3-1 filter). Years included: 1870-2006.

E N D
Assessing Tropical Cyclone Risk In A Warming World Kerry Emanuel Earth, Atmospheric, and Planetary Sciences Massachusetts Institute of Technology
Atlantic Sea Surface Temperatures and Storm Max Power Dissipation (Smoothed with a 1-3-4-3-1 filter) Years included: 1870-2006 Power Dissipation Index (PDI) Scaled Temperature Data Sources: NOAA/TPC, UKMO/HADSST1
Effect of Increased Potential Intensity on Hurricane Katrina
Some U.S. Hurricane Damage Statistics: • >50% of all normalized damage caused by top 8 events, all category 3, 4 and 5 • >90% of all damage caused by storms of category 3 and greater • Category 3,4 and 5 events are only 13% of total landfalling events; only 30 since 1870 • Landfalling storm statistics are grossly inadequate for assessing hurricane risk
Using Global and Regional Models to Simulate HurricanesThe Problem: • Global models are far too coarse to simulate high intensity tropical cyclones • Embedding regional models within global models introduces problems stemming from incompatibility of models, and even regional models are usually too coarse • Models to expensive to run many times.
Global Models do not simulate the storms that cause destruction! Modeled Histograms of Tropical Cyclone Intensity as Simulated by a Global Model with 50 km grid point spacing. (Courtesy Isaac Held, GFDL) Observed Category 3
To the extent that they simulate tropical cyclones at all, global models simulate storms that are largely irrelevant to society and to the climate system itself, given that ocean stirring effects are heavily weighted towards the most intense storms
What are the true resolution requirements for simulating tropical cyclones?
Numerical convergence in an axisymmetric, nonhydrostatic model (Rotunno and Emanuel, 1987)
Another Major Problem with Using Global and/or Regional Models to Simulate Tropical Cyclones: Model TCs are not coupled to the ocean
Comparing Fixed to Interactive SST: Model with Fixed Ocean Temperature Model including Ocean Interaction
Our Solution: Drive a simple but very high resolution, coupled ocean-atmosphere TC model using boundary conditions supplied by the global model or reanalysis data set Phrase in Angular Momentum Coordinates
Risk Assessment Approach: Step 1: Seed each ocean basin with a very large number of weak, randomly located cyclones Step 2: Cyclones are assumed to move with the large scale atmospheric flow in which they are embedded, plus a correction for beta drift Step 3: Run the CHIPS model for each cyclone, and note how many achieve at least tropical storm strength Step 4: Using the small fraction of surviving events, determine storm statistics. Details: Emanuel et al., Bull. Amer. Meteor. Soc, 2008
200 Synthetic U.S. Landfalling tracks (color coded by Saffir-Simpson Scale)
Calibration Absolute genesis frequency calibrated to North Atlantic during the period 1980-2005
Genesis rates Western North Pacific Southern Hemisphere Eastern North Pacific Atlantic North Indian Ocean
Seasonal Cycles Atlantic
Cumulative Distribution of Storm Lifetime Peak Wind Speed, with Sample of 1755Synthetic Tracks 95% confidence bounds
Couple to Storm Surge Model (SLOSH) Courtesy of Ning Lin, Princeton University
Histogram of the SLOSH-model simulated storm surge at the Battery for 7555 synthetic tracks that pass within 200 km of the Battery site.
Now Use Daily Output from IPCC Models to Derive Wind Statistics, Thermodynamic State Needed by Synthetic Track Technique
Compare two simulations each from 7 IPCC models: 1.Last 20 years of 20th century simulations2. Years 2180-2200 of IPCC Scenario A1b (CO2 stabilized at 720 ppm)
IPCC Emissions Scenarios This study
Projected Warming: This study
Basin-Wide Percentage Change in Power Dissipation Different Climate Models
Economic Analysis of Impact of Climate Change on Tropical Cyclone Damages With Robert Mendelsohn Yale
Assessing the Impact of Climate Change • Measure how climate change affects future extreme events • Reflect any underlying changes in vulnerability in future periods • Estimate damage functions for each type of extreme event • Estimate future extreme events caused by climate change
Integrated Assessment Model Emissions Trajectory Climate Scenario Event Risks Vulnerability Projection Damage Function Damage Estimate
Climate Models • CNRM (France) • ECHAM (Germany) • GFDL (U.S.) • MIROC (Japan; tropical cyclones only)
Baseline Changes in Tropical Cyclone Damage (due to population and income, holding climate fixed) • Current Global Damages: $13.9 billion/yr • Future Global Damages: 30.6 billion/yr • Current Global Deaths: 18,918/yr • Future Global Deaths: 7,168/yr
Examples of Modeling Output Current and Future Probability Density of U.S. Damages, MIROC Model Current and Future Damage Probability, MIROC Model
Limitations • All steps of the integrated assessment are uncertain: emission path, climate response, tropical cyclone response, and damage function • Sea level rise not yet taken into account • Relationship between storm intensity and fatalities is uncertain • Country level analysis is desirable (likely gains in accuracy from finer resolution analysis)
Summary: • History to short and inaccurate to deduce real risk from tropical cyclones • Global (and most regional) models are far too coarse to simulate reasonably intense tropical cyclones • Globally and regionally simulated tropical cyclones are not coupled to the ocean
We have developed a technique for downscaling global models or reanalysis data sets, using a very high resolution, coupled TC model phrased in angular momentum coordinates • Model shows high skill in capturing spatial and seasonal variability of TCs, has an excellent intensity spectrum, and captures well known climate phenomena such as ENSO and the effects of warming over the past few decades
Application to global models under warming scenarios shows great regional and model-to-model variability. As with many other climate variables, global models are not yet capable of simulating regional variability of TC metrics • Predicted climate impacts from all extreme events (including tropical storms) range from $17 to $25 billion/yr global damages by 2100 • Equivalent to 0.003 to 0.004 percent of GWP by 2100 • Climate change also predicted to increase fatalities by 2200 to 2500 deaths/yr