Download
1 / 11
110 likes | 207 Vues
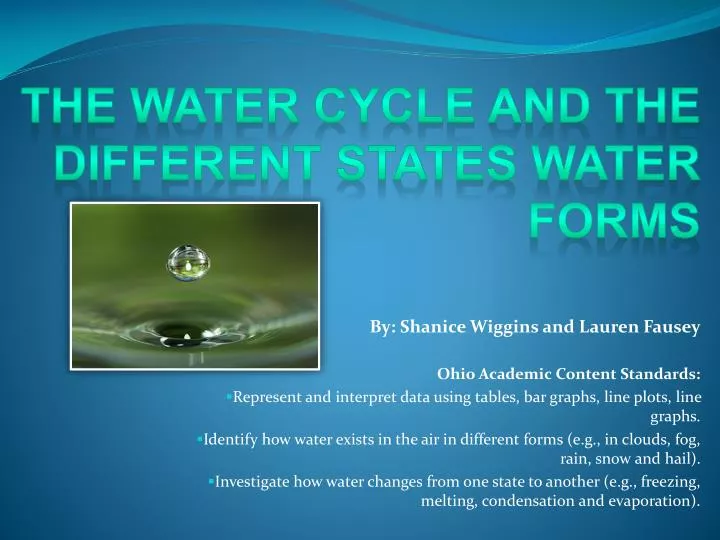
The Water Cycle and the Different States Water Forms. By: Shanice Wiggins and Lauren Fausey Ohio Academic Content Standards: Represent and interpret data using tables, bar graphs, line plots, line graphs.

E N D
The Water Cycle and the Different States Water Forms By: Shanice Wiggins and Lauren Fausey Ohio Academic Content Standards: Represent and interpret data using tables, bar graphs, line plots, line graphs. Identify how water exists in the air in different forms (e.g., in clouds, fog, rain, snow and hail). Investigate how water changes from one state to another (e.g., freezing, melting, condensation and evaporation).
Solid • Is the state of matter in which all particles are held together in a geometric patterns. They have enough energy to vibrate but not enough to move around. • Examples of Water: • Snow • Hail • Ice • Frost
Liquid • This is the state of matter in which particles have enough energy to move over and around each other, but not beat all attracting forces. • Examples of Water: • Oceans • Rivers • Lakes • Running Water • Swamps
Gas • This is the state of matter in which all particles have enough energy to move freely and overcome all attracting forces • Features of Gas:
Definitions of Water Cycle • Precipitation is made up of any type of water that falls to the earth like snow, hail, mist, or rain. • Transpiration happens when plants give off water vapor through tiny pores in their leaves. • Infiltrationhappens when water soaks into the soil from the ground level. • Condensation is when the gas cools and loses energy. Then the particles are forced to change state, from a gas to a liquid. • Evaporation is when warmth from the sun causes water from lakes, streams, ice, and soils to turn into water vapor in the air.
Key Points of Bar and Line Graphs Bar Graphs • Independent variable goes on the horizontal axis if the bars are going in the vertical direction. • Dependent variable will go on vertical axis • Good to show results that aren’t continuous • Useful to get an overall idea of responses • Each bar shows the amount Line Graphs • The Independent variable will go on the horizontal axis. • The dependent variable will go on the vertical axis. • Shows results that are continuous • Show relationships between 2 major variables • A point is placed by the amount and a line is drawn to connect the point.
References • Pictures from: • Flickr Creative Commons • Google Images • Sound from Clipart • Graphs from Interactive Graph Website • Definitions from F:\final ETPT project\EEK! - Round & Round It Goes! - Water Cycle.mht