Download
1 / 23
230 likes | 336 Vues
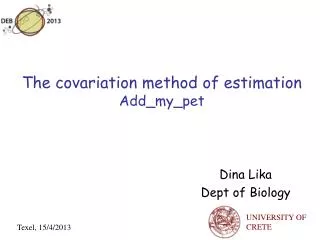
Covariation of parameter values. Dina Lika Dept of Biology. UNIVERSITY OF CRETE. Texel, 15/4/2013. TexPoint fonts used in EMF. Read the TexPoint manual before you delete this box.: A A A. Contents. Scales of life in space & time Primary vs compound parameters

E N D
Covariation of parameter values Dina Lika Dept of Biology UNIVERSITY OF CRETE Texel, 15/4/2013 TexPoint fonts used in EMF. Read the TexPoint manual before you delete this box.: AAA
Contents • Scales of life in space & time • Primary vs compound parameters • Covariation of parameter values • Intensive & extensive parameters • Primary and secondary scaling relationships • What parameters can be estimated from what data?
Scales of life Life span 10log a Volume 10log m3 30 earth 20 10 life on earth whale whale 0 bacterium ATP molecule -10 bacterium -20 water molecule -30
Dwarfing in Platyrrhini 180 g Cebidae 130 g Saimiri 200-400 g Saguinus 400-535 g 480-700 g 400-450 g 780-1250 g 700-1000 g 3500 g Callitrix Callimico Cebuella Leontopithecus MYA Mico Aotus 24.8 20.2 Perelman et al 2011 Plos Genetics7, 3, e1001342 Cebus
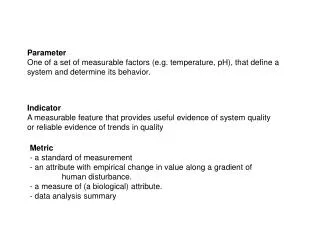
Primary vs Compound parameters • Primary parameters • Connected to a single underlying process • Compound parameters • Depend on several underlying processes
Primary DEB parameters time-length-energy time-length-mass The two frames are related to each other via Chemical potential of reserves: Conversion coefficient: Temperature:T=273 +20 K Arrhenius temperature:TA =8 kK Max length:
Covariation of parameter values • Primary scaling relationships • Covariation of primary parameters • Secondary scaling relationships • Covariation of compound parameters • Tertiary scaling relationships • Deal with phenomena at larger scales in time and space
Covariation of primary parameter • Intensive parameters • Depend on local (bio)chemical environment • Relate to molecular processes • Size independent • Density-based • Extensive parameters • Relate to the physical design • Size dependent
Primary scaling relationships assimilation {pAm} max surface-specific assim rate Lm feeding {Fm} surface- specific searching rate digestionκX digestion efficiency mobilisation v energy conductance allocation allocation fraction to soma reproduction R reproduction efficiency turnover,activity [pM] volume-specific somatic maint. costs heating,osmosis {pT} surface-specific somatic maint. costs development kJ maturity maintenance rate coefficient Growth [EG] specific growth for structure life cycle EHb maturity at birth Lm3 life cycle EHp maturity at puberty Lm3 agingha Weibul aging acceleration Lm aging sG Gompertz stress coefficient maximum length Lm = {pAm} / [pM] Kooijman 1986 J. Theor. Biol. 121: 269-282
Secondary scaling relationships The reserve capacity The energy investment ratio Somatic maintenance rate coefficient
Von Bertalanffy growth rate 25 °C TA = 7 kK 10log von Bert growth rate, a-1 10log ultimate length, mm 10log ultimate length, mm ↑ ↑ 0
Feeding rate slope = 1 Filtration rate, l/h Mytilus edulis Data: Winter 1973 poikilothermic tetrapods Data: Farlow 1976 Length, cm Inter-species:JXm L3 Intra-species:JXm L2
Body weight Body weight has contribution from structure and reserve if reproduction buffer is excluded
Scaling of respiration Respiration: contributions from growth and maintenance Weight: contributions from structure and reserve Kooijman 1986 J Theor Biol 121: 269-282
Metabolic rate slope = 1 Log metabolic rate, w O2 consumption, l/h 2 curves fitted: endotherms 0.0226 L2 + 0.0185 L3 0.0516 L2.44 ectotherms slope = 2/3 unicellulars Log weight, g Length, cm Intra-species Inter-species (Daphnia pulex) Data: Richman 1958; curve fitted from DEB theory Data: Hemmingson 1969; curve fitted from DEB theory
measured quantities primary pars Standard DEB model (isomorph, 1 reserve, 1 structure) reserve & maturity: hidden variables measured for 2 food levels primaryparameters
DEBtool/animal/get_pars Functions get_pars_* obtain compound DEB parameters from easy-to-observe quantities Functions iget_pars_* do the reverse, which can be used for checking. The routines are organized as follows: get_pars iget_pars food level one several one several Constraint kJ = kM kJ != kM kJ = kM kJ = kM kJ != kM kJ = kM growthget_pars_gget_pars_hget_pars_iiget_pars_giget_pars_higet_pars_i growth & reprodget_pars_rget_pars_sget_pars_tiget_pars_riget_pars_siget_pars_t Functions for several food levels do not use age at birth data. If one food level is available, we have to make use of the assumption of stage transitions at fixed amounts of structure (kM = kJ). If several food levels are available, we no longer need to make this assumption, but it does simplify matters considerably. Functions elas_pars_g and elas_pars_r give elasticity coefficients. Function get_pars_u converts compound parameters into unscaled primary parameters at abundant food. Kooijman at al 2008 Biol Rev83: 533-525
DEBtool/animal/get_pars g r h get_pars_ s u g r iget_pars_ h s red quantities depend on food level, green do not Kooijman at al 2008 Biol Rev83: 533-525