Download
1 / 20
200 likes | 265 Vues
Second Ph’d training talk Prediction of climate extreme events at seasonal and decadal time scale. Aida Pintó Biescas. Outline. Introduction Methodology Data description Methods Results Future work Near term work Long term work. 2. Outline. Introduction Methodology

E N D
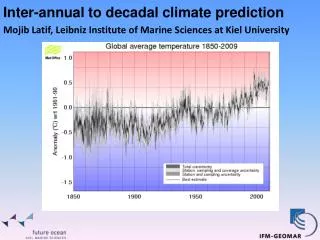
Second Ph’d training talk Prediction of climate extreme events at seasonal and decadal time scale Aida Pintó Biescas
Outline • Introduction • Methodology • Data description • Methods • Results • Future work • Near term work • Long term work 2
Outline • Introduction • Methodology • Data description • Methods • Results • Future work • Near term work • Long term work 3
Introduction Climate change will lead by the end of the century to changes in the frequency and intensity of extreme events Lack of information (when, where, frequency, intensity,…) Need to forecast extreme events taking into account interannual variability and the impact of the anthropogenic climate change Analysis of the forecast quality of seasonal and decadal climate predictions Predicting evolution of extreme event frequency, duration and intensity and application climate forecast information in a climate services context Integrate climate information in decision making processes. 4
Introduction Thesis main objective: Provide a synthesis of the forecast quality of seasonal-to-decadal climate predictions for different types of extreme climate events, performed with both global dynamical and statistical models General objectives: • Study the sources of predictability and the forecast quality using state-of-the art forecast systems for extreme precipitation, temperature and drought events, and the frequency of North Atlantic tropical cyclones , at seasonal-to-decadal time scales. • Develop methods to communicate the results of the predictive climate forecast information, in the context of a climate service for the insurance and renewable-energy sectors. 5
Outline • Introduction • Methodology • Data description • Methods • Results • Future work • Near term work • Long term work 6
Methodology MODEL DATA: ENSEMBLES prediction system • Atmospheric data from daily seasonal hindcasts of the ENSEMBLES Stream 2 experiment. • Precipitation and temperature daily data for five forecast systems contributing to the multi-model: • ECMWF's IFS/HOPE • UK Met Office's HadGEM2 • Météo-France's ARPEGE/OPA • INGV's ECHAM5/OPA • IFM Kiel's ECHAM5/OM1 • 9 members each, with different initial conditions. • Seasonal forecasts starting every year since 1960 until 2005 for four different start dates (the first of February, May, August and November). 7
Methodology REFERENCE DATA: ECMWF Interim Re-analysis (ERA Interim) Daily Atmospheric Data Sets • Daily gridded reanalysis dataset for precipitation and near surface temperature. • Period 1979-Now (uploaded monthly). • Resolution 0.75º x 0.75º. • Accumulated daily precipitation. • Tmax and Tmin daily surface temperature from 6 hourly registers. 9
METHODOLOGY • Extreme indices defined in the SREX report (IPCC, 2012): • T90p: 90th percentile of the daily temperature for a given month (K). • T10p: 10th percentile of the daily temperature for a given month (K). • Tmean: Mean monthly temperature averaged from all the days of the month (K). • R90p: 90th percentile of the total daily precipitation amount (mm). • Rmean: Mean monthly precipitation averaged from all the days of the month (mm/month). • Forecast quality assessment: • Systematic error: Bias between the observations and each forecast system. • Correlation coefficient for each index, for each lead month and each start date for each forecast system and for the MME. • Differences between each index correlation and Tmean/Rmean correlation.
Outline • Introduction • Methodology • Data description • Methods • Results • Future work • Near term work • Long term work 11
Results MME August 90th percentile correlation for the surface temperature for the start date of May 12
Results Correlation for the 90th percentile of the surface temperature between the multimodel and the reanalysis for the start date of February 13
Results Correlation for the 10th percentile of the surface temperature between the multimodel and the reanalysis for the start date of February 14
Results Correlation for the 90th percentile of the total daily precipitaion between the multimodel and the reanalysis for the start date of February 15
Results Difference between the correlation of the 90th percentile and the correlation of the mean of the surface temperature between the multimodel and the reanalysis for the start date of May 16
Results Difference between the correlation of the 90th percentile and the correlation of the mean of the total daily precipitation between the multimodel and the reanalysis for the start date of May 17
Outline • Introduction • Methodology • Data description • Methods • Results • Future work • Near term work • Long term work 18
Future work Near term work • Repeat same analysis for the 90th and 10th percentile of Tmax and Tmin. • Apply RMSE and RMSS. • Illustrate cases with good or bad skill selecting two points. • Illustrate the predictions using two extreme events. Long term work • Preparation of promotional material. • Publication in a scientific journal with the results obtained on the prediction of extreme seasonal precipitation and temperature. • Downloading new data from wind and solar radiation and repeat the same steps . • Formulation of probability forecasts of the North Atlantic tropical cyclone frequency. 19
Thanks Gràcies 20