Download
1 / 40
400 likes | 518 Vues
Textual Data; Visual Variables. Administration. Sprechstunden T 14-15, Th 16-17 (on the web site) Online collaboration tools? e.g. wikis. Languages. What languages do people know, and to what extent? (Basic, Intermediate, Advanced) CuC: Advanced: English

E N D
Textual Data; Visual Variables LInfoVis Winter 2011 Chris Culy
LInfoVis Winter 2011 Chris Culy Administration Sprechstunden T 14-15, Th 16-17 (on the web site) Online collaboration tools? e.g. wikis
LInfoVis Winter 2011 Chris Culy Languages What languages do people know, and to what extent? (Basic, Intermediate, Advanced) CuC: Advanced: English Intermediate: French, German, Italian, Spanish Basic: Bambara, Fula, Dogon
LInfoVis Winter 2011 Chris Culy Visualizing the metadata How might we visualize this “metadata”? Better: how do we think about visualizing it? Important aspects: What is the data? (The data) Who will be using it? (The user) What will they be trying to do? (The task) cf. Data repository project
LInfoVis Winter 2011 Chris Culy The project Goal: develop a scientific visualization of some kind of linguistic data Start thinking about what kind of data you want to visualize, and where you'll get it Who: Small groups If you are inexperienced in programming, work with someone who is more experienced Progress? Questions?
LInfoVis Winter 2011 Chris Culy Current visualizations What LInfoVis visualizations have you used? For what purposes? Did/do you wish they could be better? How?
LInfoVis Winter 2011 Chris Culy About the references in the tutorial One more: Ware, Colin. 2004. Information Visualization, Second Edition: Perception for Design. Bertin: seminal work on visual variables Card, McKinlay, Shneiderman, Ware: Important research contributions to InfoVis Hearst: Interesting combination of InfoVis, UI design, information retrieval Tufte: Very influential (sometimes controversial) about presentation of information
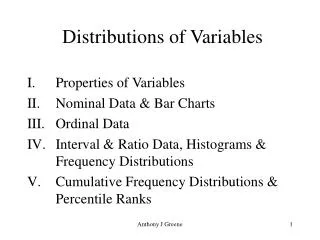
LInfoVis Winter 2011 Chris Culy Data types(cf. Tutorial, Hearst, 2009) Quantitative data: numbers, etc. that can be processed arithmetically Categorical data: everything else Interval: ordered data with measurable distances (e.g. months) Ordinal: ordered data without measurable distances (e.g. hot-warm-cold) Nominal: data without (relevant) organization (e.g. weather types, a collection of names) Hierarchical:* data without order, arranged into subsuming groups (e.g. {{ mammals, { bear …}, { cat { lynx…},…},…},…}, etc.) cf. GermaNet Quantitative, interval, and ordered data are easier to convey visually than nominal data.
LInfoVis Winter 2011 Chris Culy More on hierarchical data Some hierarchical data in linguistics is a bit more complicated. Consider a linguistic analysis tree. data without order arranged into subsuming groups Now consider a treebank (collection of trees) data without order (trees don’t have, but what about metadata?) Arranged into subsuming groups (possible, but not natural)
LInfoVis Winter 2011 Chris Culy Textual data(cf. tutorial) We are interested in the information/properties of textual elements e.g. word frequency, syntactic structure, emotion content, etc. However, in many cases, the actual textual items are important for understanding the information, so they must be indicated in the visualization. “The categorical nature of text, and its very high dimensionality, make it very challenging to display graphically.” (Hearst, 2009)
LInfoVis Winter 2011 Chris Culy Non-mappability of text(cf. tutorial) The problem is less about the information about textual elements, but the textual elements themselves: they take up space. Textual items are not mappable We (usually) cannot effectively represent them by something else meaningful (e.g. shape, color, position, etc.) Textual items are too variable (Hearst’s high dimensionality) and too complex to be reduced to a more compact representation, even a label The details of the textual items are often crucial to understanding the data (e.g. context in a concordance)
LInfoVis Winter 2011 Chris Culy What to do?(cf. tutorial) This is a huge challenge for LInfoVis! Not a solved problem Interactive visualizations will be the key to the solution(s) Show only some of the data, and interact to get more Data filtering/selection will also be key Cf. Data filtering/selection in InfoVis more generally Need domain and task specific information
LInfoVis Winter 2011 Chris Culy Visual variables A visual variable is a visual property that can be varied in order to convey (encode) information.
LInfoVis Winter 2011 Chris Culy Visual data transcription: visual variables(from tutorial) Value = Brightness Taken from: M. Carpendale, "Considering visual variables as a basis for information visualisation“, Dept. of Computer Science, University of Calgary, Canada, Tech. Rep. 2001-693-16, 2003, Table 1. 14
LInfoVis Winter 2011 Chris Culy Visual variables: characteristics (1)(from tutorial) 5 key characteristics • Selectivity: Different values are easily seen as different “Is A different from B?” Worst case: visual properties of all objects need to be looked at one by one 15
LInfoVis Winter 2011 Chris Culy Visual variables: characteristics (2)(from tutorial) • Associativity: Similar values can easily be grouped together “Is A similar to B?” Positioning> {size, brightness} > {color, orientation (for points)} > texture > shape Full selectivity / associativity No selectivity / associativity 16
LInfoVis Winter 2011 Chris Culy Visual variables: characteristics (3)(from tutorial) • Order: Different values are perceived as ordered “Is A more/greater/bigger than B?” • Size and brightness are ordered • Orientation, shape, texture are not ordered • Hue is somewhat ordered 17
LInfoVis Winter 2011 Chris Culy Visual variables: characteristics (4)(from tutorial) • Quantity: A number can be deduced from differences “How much is the difference between A and B?” • Position is quantitative, size is somewhat quantitative • The other variables are not quantitative 18
LInfoVis Winter 2011 Chris Culy Visual variables: characteristics (5)(from tutorial) • Length: The number of distinctions possible using the variable “How many different things can we represent with this variable?” • Shape, Texture: infinite, but … • Brightness, hue: 7 (Association) – 10 (Distinction) • Size: 5 (Association) -20 (Distinction) • Orientation: 4 19
LInfoVis Winter 2011 Chris Culy An experiment
LInfoVis Winter 2011 Chris Culy Made with http://www.wordle.net/
LInfoVis Winter 2011 Chris Culy Made with http://www.tocloud.com/
LInfoVis Winter 2011 Chris Culy Combining visual variables When we use 2 visual variables for an element, how independently do we perceive the two variables? If we perceive them separately, they are separable. If we perceive them together, they are integral.
LInfoVis Winter 2011 Chris Culy Test 1 C B A
LInfoVis Winter 2011 Chris Culy Test 2 C B A
LInfoVis Winter 2011 Chris Culy Integral/Seperable Red/green and yellow/blue Width and height Size and orientation Color and shape Color and motion Ware 2004:181 Color and location
LInfoVis Winter 2011 Chris Culy Integral/Seperable Red/green and yellow/blue More integral Red/green and black/white Width and height Shape and size Color and size Shape and direction of motion Color and shape Color and direction of motion Position and size OR shape OR color More separable cf. Ware 2004:180
LInfoVis Winter 2011 Chris Culy Gestalt psychology and perception Early 20th century, with a lot of work on aspects of visual perception and how people organize what they see. Relevant for visualization: Reification (somewhat): we perceive more information than is present e.g. illusory contours Source: http://en.wikipedia.org/wiki/File:Kanizsa_triangle.svg
LInfoVis Winter 2011 Chris Culy Gestalt Principles of Grouping Some basic sources http://psychology.about.com/od/sensationandperception/ss/gestaltlaws.htm http://en.wikipedia.org/wiki/Principles_of_grouping http://en.wikipedia.org/wiki/Gestalt_psychology More detail: http://www.scholarpedia.org/article/Gestalt_principles
LInfoVis Winter 2011 Chris Culy Gestalt Principles of Grouping Similarity Objects with common visual attributes are perceived as being part of the same group Source: http://psychology.about.com/od/sensationandperception/ss/gestaltlaws_2.htm
LInfoVis Winter 2011 Chris Culy Gestalt Principles of Grouping Proximity Objects that are near each other in space (or time) are perceived as forming a group.
LInfoVis Winter 2011 Chris Culy Gestalt Principles of Grouping Continuity A pattern of objects (in space, time) tends to be continued. Source: http://www.scholarpedia.org/article/Gestalt_principles
LInfoVis Winter 2011 Chris Culy Gestalt Principles of Grouping Law of Common Fate Objects moving in the same direction are perceived as a group. Note: Difficult to use in (L)Infovis, since we need to be able to focus easily on the information.
LInfoVis Winter 2011 Chris Culy Using visual variables (1)(cf. tutorial) “Sameness of a visual element implies sameness of what the visual element represents” (Tufte, 2006) Cf. Principles of grouping
LInfoVis Winter 2011 Chris Culy Using visual variables (2)(cf. tutorial) Characteristics of visual variables determine their use e.g. Ordered values have to be represented by ordered visual variables
LInfoVis Winter 2011 Chris Culy Using visual variables (3)(cf. tutorial) Be consistent concerning relations of similarity, proportion and configuration
LInfoVis Winter 2011 Chris Culy Using visual variables (4)(cf. tutorial) Adhere to conventional uses of visual variables e.g. in cartography use blue color for water Scales should be made up of visually equidistant values of a variable
LInfoVis Winter 2011 Chris Culy Using visual variables (5)(cf. tutorial) The full range of a visual variable should be used e.g. when using shades of gray, use from white to black The number of visual variables of a visualization should correspond to the dimensionality of the represented information But sometimes dual encoding can be useful
LInfoVis Winter 2011 Chris Culy Using visual variables (6) When combining two visual variables, if people should be able to analyze the two attributes independently, then separable variables should be used.
LInfoVis Winter 2011 Chris Culy For next time