Download
1 / 34
340 likes | 420 Vues
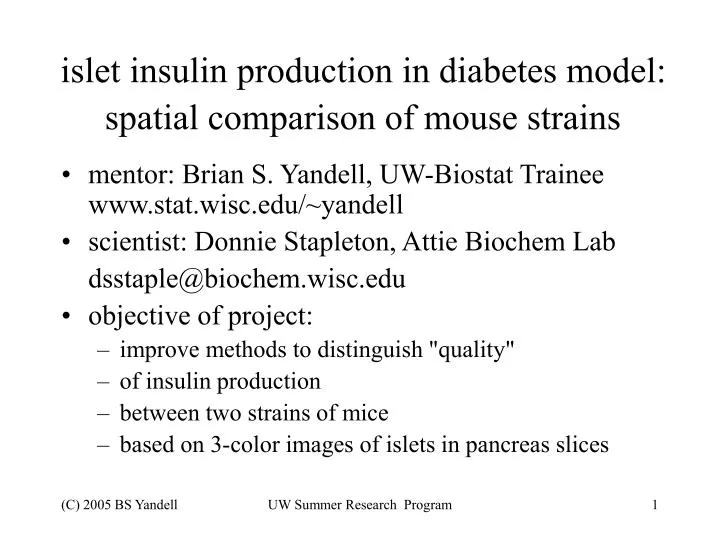
islet insulin production in diabetes model: spatial comparison of mouse strains. mentor: Brian S. Yandell, UW-Biostat Trainee www.stat.wisc.edu/~yandell scientist: Donnie Stapleton, Attie Biochem Lab dsstaple@biochem.wisc.edu objective of project: improve methods to distinguish "quality"

E N D
islet insulin production in diabetes model:spatial comparison of mouse strains • mentor: Brian S. Yandell, UW-Biostat Trainee www.stat.wisc.edu/~yandell • scientist: Donnie Stapleton, Attie Biochem Lab dsstaple@biochem.wisc.edu • objective of project: • improve methods to distinguish "quality" • of insulin production • between two strains of mice • based on 3-color images of islets in pancreas slices UW Summer Research Program
why do this project? • Knowledge/Skills needed • Basic statistics (t-test, ideally some nonparametrics) • R programming (a la biostat training) • Knowledge/Skills obtained • communication skills with scientist (lab biochemist) • image analysis basics • nonparametric density estimation (mechanics at least) • experimental design considerations (nesting, balance, etc.) UW Summer Research Program
project abstract • insulin is produced in the pancreas • specifically the Islets of Langerhans by "beta" cells • (there are "alpha" cells as well.) • scientists in biochemistry have imaged hundreds of islets • for two strains of obese mice • BTBR.ob mimics type II (mature onset) diabetes mellitus • B6.ob appears healthy • roughly a hundred islets per mouse, 3 mice per strain • can visually see differences in production of insulin in beta cells • have summary measurements on many islets to compare strains • opportunity beyond data analysis • how to improve measurement process? • how to improve experimental design? • goal: clearly infer differences in "quality" of insulin production • between BTBR.ob and B6.ob • you can meet with the scientist and work with measurement system UW Summer Research Program
of mice and men • obese strains: BTBR.ob vs. B6.ob • obese BTBR mice mimic human diabetes • high glucose, low insulin • obese B6 mice appear non-diabetic • congenic substrains A and B • mostly BTBR mouse genome • A congenic: insert small segment of B6 • B congenic: essentially BTBR mice UW Summer Research Program
glucose insulin UW Summer Research Program (courtesy AD Attie)
Type 2 Diabetes Mellitus UW Summer Research Program
Insulin Requirement decompensation UW Summer Research Program from Unger & Orci FASEB J. (2001) 15,312
islet degradation seriesA vs. B congenics 1 2 3 4 5 healthy sick UW Summer Research Program
comparison of 3 type A and 2 type B congenicmice healthy sick UW Summer Research Program
A and B congenic data A congenics: Class.I Class.II Class.III Class.IV Class.V Total.Islets A33-18 26 36 23 21 40 146 A34-22 55 36 24 18 10 143 A39-15 69 60 41 35 41 246 B congenics: Class.I Class.II Class.III Class.IV Class.V Total.Islets A34-19 87 37 35 35 9 203 A48-4 44 29 12 19 7 111 UW Summer Research Program
B6 Female&Male OB 14wk UW Summer Research Program
Btbr Female& Male OB 14wk UW Summer Research Program
Btbr Male & Female OB 14wks UW Summer Research Program
total percent area for islets raw totals log2 totals UW Summer Research Program
percent glu/som, dapi, insulinby mouse (smooth histogram + median) UW Summer Research Program
sum of insulin, glu/som, dapi percents UW Summer Research Program
percent pairs (correlation) plot UW Summer Research Program
intensity pairs (correlation) plot UW Summer Research Program
calibration study UW Summer Research Program
Dot plo:t Insulin vs Area of islet UW Summer Research Program
Dot plot: Glu/Som vs Area of Islet UW Summer Research Program
Dot plot: Insulin vs Glu/Som UW Summer Research Program
Female ob/ob B6 UW Summer Research Program
Female ob/ob BTBR UW Summer Research Program
Male ob/ob B6 UW Summer Research Program
Male ob/ob BTBR UW Summer Research Program
Summary table for ob/ob B6 and Btbr islets UW Summer Research Program
14 week Congenic Females • Is there a difference between A & B congenics? • Is there a difference between Btbr and the B congenic strain? • How does the glucose and insulin values effect our comparisons? UW Summer Research Program
Btbr Female OB 14wk UW Summer Research Program
A33-18, Female OB A 14wk UW Summer Research Program
A34-19, Female OB B 14wk UW Summer Research Program
A34-22, Female OB A 14wk UW Summer Research Program
A39-15, Female OB A 14wk UW Summer Research Program
A48-4, Female OB B 14wk UW Summer Research Program