Download
1 / 87
880 likes | 1.19k Vues
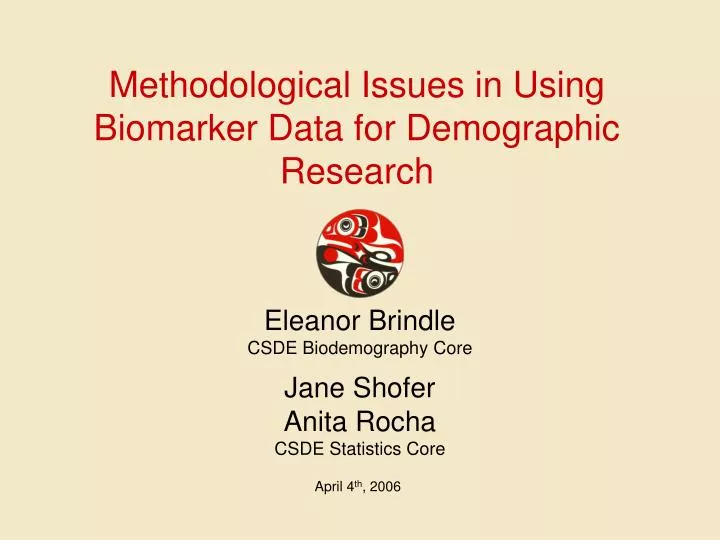
Methodological Issues in Using Biomarker Data for Demographic Research. Eleanor Brindle CSDE Biodemography Core Jane Shofer Anita Rocha CSDE Statistics Core. April 4 th , 2006. Methodological Issues…. I. Biomarker methods Introduction to biomarkers and their use in population research

E N D
Methodological Issues in Using Biomarker Data for Demographic Research Eleanor Brindle CSDE Biodemography Core Jane Shofer Anita Rocha CSDE Statistics Core April 4th, 2006
Methodological Issues… I. Biomarker methods • Introduction to biomarkers and their use in population research • Brief overview of techniques commonly used to measure biomarkers • Introduction to the kinds of measurement error in those techniques II. Statistical methods useful for biomarker data • Incorporating known measurement error into power analyses • Dealing with repeated measures issues (frequently encountered in biomarker data)
I. Biomarker Methods • What is a biomarker • How are biomarkers measured • What underlying process do you really want to know about, and what are you really measuring? • For example, cortisol does many things. Are you measuring cortisol to learn about metabolism or stress? Chronic or acute stress? • White coat effect, binding proteins and receptors (bioactive or not), metabolites, other potentially complicating factors • For example, Vitamin A levels can be affected by immune status • Sampling issues—frequency, diurnal patterns, fluid type • Dictated by biology, technology and your questions • Measurement error types • Sensitivity, specificity, accuracy, precision
II. Statistical Considerations for Biomarker Data • Power • Take advantage of having well-characterized measurement error • Repeated measures • Often encounter non-independence in biomarker data
Biomarker Methods • What is a biomarker • How are biomarkers measured • What underlying process do you really want to know about, and what are you really measuring? • Sampling issues—frequency, diurnal patterns, fluid type • Measurement error types
Using Biomarkers in Population Research What is a biomarker? • Has had different meanings, but is now widely used to indicate any marker of underlying biology you care to measure. • Common goal in biodemography is to integrate biological, behavioral, and social/cultural levels of analysis. • A biomarker in this field is generally something that tells you about something else • Unlike in biology, the biomarker itself is rarely of interest in this field.
Using Biomarkers in Population Research Biomarkers are used to estimate • health, disease • hidden heterogeneity frailty, risk • nutritional status • behaviors (smoking, drugs of abuse) • exposure to environmental contaminants • population differences in disease prevalence or risk factors • markers of aging or other biological events (puberty)
Using Biomarkers in Population Research Biomarkers • blood pressure • anthropometrics (height, weight, limb length) • molecules in the blood, urine or saliva • Hormones, micro- or macronutrients, disease markers, toxins, environmental contaminants, etc. • Immunoassays commonly used, but there are many other methods • lung function • pulse rate or pattern • brain activity • genetic markers • disease risk, aging, behaviors, relatedness of populations
Using Biomarkers in Population Research Why biomarkers instead of self-reports? • Self reports not useful for undiagnosed or sub-clinical health problems • Biomarkers may have advantages where self reports are likely to be subjective (i.e. stress) or inaccurate (i.e. smoking, BMI) • Difference between subject perception and biomarker results may be interesting in and of itself (such as for health or stress) • Even perfect self-reports can only tell part of the story
National Health and Nutrition Examination Survey (NHANES) The National Longitudinal Study of Adolescent Health (AddHealth) MacArthur Successful Aging Study Coronary Artery Risk Development in Young Adults Study (CARDIA) Social and Environmental Biomarkers of Aging Study (SEBAS) Framingham Heart Study Whitehall Civil Servants Study Hypertension Detection and Follow-up Program Women’s Health Initiative (WHI) Study of Women’s Health Across the Nation (SWAN) Melbourne Women’s Midlife Health Project (MWMHP) Cebu Longitudinal Health and Nutrition Survey (CLHNS) The Health and Retirement Study (HRS) Examples of Studies Using Biomarkers
Links to more NIH and CDC sites: http://www.nih.gov/icd/ http://www.nia.nih.gov/ResearchInformation/ScientificResources/ http://resresources.nci.nih.gov/categorydisplay.cfm?catid=9 http://apps.nhlbi.nih.gov/popstudies/ http://www.clinicaltrials.gov/ http://www.niaid.nih.gov/daids/aidsdata.htm http://pubs.niaaa.nih.gov/publications/datasys.htm http://www.nichd.nih.gov/resources/resources.htm http://www.nichd.nih.gov/about/cpr/dbs/res_ss_large.htm http://www.cdc.gov/nchs/datawh.htm http://www.cdc.gov/nchs/express.htm
Participation in cultural activities by risk and cortisol group Using Biomarkers in Population Research • Low and high salivary cortisol groups based on bottom and top 25%. • Y axis: • Geometric mean for risk behaviors and attitudes • X axis: • Summary score, average participation in cultural activities during the past year activities and degree of activity’s importance on 1-5 scale Schechter et al. 2006 Gender differences in salivary cortisol and measures of bicultural identity in a sample of Native American youth. Annual Meeting of the Human Biology Association, Anchorage, Alaska.
NHANESNational Health and Nutrition Examination and Surveyfrom the National Center for Health Statistics, part of the CDC NHANES I – 1971 to 1975, N = 32,000 NHANES II – 1976-1980, N = 27,800 NHANES III – 1988-1994, N= 34,000 Starting with NHANES 1999-2000, the survey is now conducted yearly • each year N = 7000 interviews, about 5000 exams • Demographic data, interviews and exams for all phases • Exam and laboratory components provide data on a wide range of biomarkers
Triglycerides HIV antibody Insulin/c-peptide Herpes 1 and 2 antibody Syphilis HPV antibody PSA FSH/LH Latex Vitamin D TSH/TH Parathyroid hormone Transferrin receptor Surplus sera Vitamin B6 Homocysteine Methyl malonic acid Glucose plasma Fibrinogen Hepatitis AntiHBs Hepatitis A, B, C, D HbSAg Selenium Chlamydia (urine) Gonorrhea (urine) NHANESBiomarkers • Albumin (urine) • Arsenic (urine) • Creatinine (urine) • NTX • Iodine (urine) • BV/Trich • MRSA • VOC exposure monitor • Pthalates (7) • Organophosphates metabolites • Metals (13) • Nonpersistent pesticides • Persistent pesticides • Phytoestrogens (8) • PAHs (16) • Dioxins • Lead dust • Complete blood count • Lead • Cadmium • Erythrocyte protoporphyrin • RBC folate • Serum folate • Glycohemoglobin • Mercury (hair) • Mercury (blood) • Mercury (urine) • CD4 • WBC/DNA • VOC (blood) • Iron • TIBC • Ferritin • Vitamin B12 • C-reactive protein • Helicobacter pylori • Cryptosporidium • Vitamin A/E/Carotenoids • Vitamin C • Measles/Varicella/Rubella • Cotinine • Chemistry panel • Bone alkaline phosphatase • Toxoplasma • Total cholesterol • HDL • LDL • Acrylamide
Add Health • Biological specimens collected in Wave III • HIV tests (20,745 oral swabs) • Sexually transmitted infection tests (12,548 urine specimens) • DNA (2612 saliva specimens) • genotyping of full siblings or twins in the same household • To “facilitate analyses that differentiate between parental, social, and genetic influence…”
Biomarker Methods • What is a biomarker • How are biomarkers measured • What underlying process do you really want to know about, and what are you really measuring? • Sampling issues—frequency, diurnal patterns, fluid type • Measurement error types
Biomarker Measurement • Often standard clinical methods are useful for population research (blood pressure, infectious and non-infectious disease, lung function, etc.) • Normal biological variation and sub-clinical conditions are often of interest in research, and clinical tools are not always well-suited to address these things • Immunoassays, HPLC, GC/MS, and other similar methods can be optimized for use in population research • Diagnostic value not always needed • Cost, practicality, and efficiency may be more important
Immunoassays Immunoassays exploit the basic nature of antibodies to capture, and then quantify, analytes. Antibodies allow measurement with excellent specificity and sensitivity to picomolar (10-12) concentrations, even when analytes are in a sea of very closely related molecules. Antibodies specific to just about any chemical, hormone, carrier protein, virus, cell, etc. can be produced.
Immunoassays In the CSDE Biodemography lab, immunoassays are carried out in the wells of microtiter plates. Other methods use the same principles to perform immunoassays in test tubes, on tissue specimens, on microscope slides, micro-fluidics discs, etc. Microtiter plates -plastic dishes with individual wells in which assays are carried out -wells are specially made to strongly bind to antibodies (among other things)
Immunoassays • Color (or radioactive, fluorescent, etc.) response is proportional to concentration (more signal, more analyte). • Regression using known doses (red circles) of the analyte are used to calibrate the assay and quantify test samples (blue squares).
Biomarker Methods • What is a biomarker • How are biomarkers measured • What underlying process do you really want to know about, and what are you really measuring? • For example, cortisol does many things. Are you measuring cortisol to learn about metabolism or stress? Chronic or acute stress? • White coat effect, binding proteins and receptors (bioactive or not), metabolites, other potentially complicating factors • For example, Vitamin A levels can be affected by immune status • Sampling issues—frequency, diurnal patterns, fluid type • Measurement error types
Using Biomarkers in Population Research • Are particular hormones associated with health or aging outcomes? Is the relationship causal? • Do individuals from different populations vary in levels of hormones or other physiological traits? Does this have health implications? Clinical implications? • What is the level of exposure of a population to pesticides or other environmental hazards?
Using Biomarkers in Population Research Some big questions in the use of biomarker data: • Are large-scale, cross-sectional surveys useful, given that some (all?) markers are dynamic? • How should SES be modeled? As a cause or an effect? • How to model the biology so the choice of which markers to use can become less arbitrary • How to model and measure stress and health markers? What is important? Current status, change, history?
Using Biomarkers in Population Research • “Downstream” markers – specific • Example: stress will elevate cortisol • “Upstream” markers - non-specific → trouble • Example: is elevated cortisol caused by stress? • Do we care? • If the issue is population health, the goal is to understand associations first, not make individual predictions
Example: Estradiol and obesity • Estradiol increases with increasing BMI. • Sex hormone binding globulin (SHBG) decreases with increasing BMI. • The combined result is that the effect of BMI on bio-available estradiol is much larger than is evident when looking at estradiol alone. • Important for cancer risk, maybe heart disease Lukanova et al. (2004) Body mass index, circulating levels of sex-steroid hormones, IGF-1 and IGF-binding protein-3: a cross-sectional study in healthy women. European J of Endo 150:161-71.
Biomarker Methods • What is a biomarker • How are biomarkers measured • What underlying process do you really want to know about, and what are you really measuring? • Sampling issues—frequency, diurnal patterns, fluid type • Dictated by biology, technology and your questions • Measurement error types
Longitudinal biomarker data One woman, daily urine samples across six months for each of five years. (Data are from the BIMORA study of the menopausal transition.)
Cross-sectional biomarker data • The Timing of Puberty Among Kenyan Rendille Youth • 35 girls aged 10 to 23 years, • 303 girls and boys, aged 4 to 10 years. • Data show mean concentrations +/- 2 SD of two reproductive hormones that are relatively low and stable before puberty
Diurnal Patterns in Cortisol Cortisol levels in 8 US adults (male and female) Shows normal diurnal variation. Cortisol is well-known as a stress hormone, but it is also a metabolic hormone.
Collection Methods Dried blood spot collection Typically one prick with a small lancet will produce 4 blood spots—enough to assay several different biomarkers
Collection Methods Salivette Saliva collection method Chew on cotton swab for 45-60 seconds In the lab we centrifuge the saliva out of the cotton swab Enough sample is collected to assay several different biomarkers
Collection Methods Whizpop Urine collection method Pure cellulose sponge is held under urine stream In the lab we centrifuge the urine out of the sponge Enough sample is collected to assay several different biomarkers
Biomarker Methods • What is a biomarker • How are biomarkers measured • What underlying process do you really want to know about, and what are you really measuring? • Sampling issues—frequency, diurnal patterns, fluid type • Measurement error types • Sensitivity, specificity, accuracy, precision
Types of error in biomarker measures:where error comes from and what it looks like • sensitivity and specificity • quantitative (continuous) data • is assay limit of detection good for physiological levels • is assay sensitive enough to detect small differences between samples • does it cross react with something else, and do we care • qualitative (discrete) data • For example, pregnancy tests, tests for infectious disease, tests for deficient or not in a nutrient, test for at risk or not of a non-infectious disease, etc. • accuracy versus precision • How are they different? • When is it useful maximize one over the other? • Want to know population average level of something, choose accuracy • Want to find a good marker of another event (ie ovulation), choose precision and adjust for known bias
Sensitivity and Specificity • Meanings of sensitivity and specificity differ in assay methods literature and epidemiology literature • In reference to assays • sensitivity • Usually means smallest dose distinguishable from zero (lower limit of detection) • sometimes used to describe the ability of an assay to reliably detect differences between two very similar values • specificity is ability of the assay to distinguish between very similar molecules
Sensitivity and Specificity:Qualitative (discrete) tests Loong (2003) Understanding sensitivity and specificity with the right side of the brain. BMJ 327:716-9
Sensitivity and Specificity in Qualitative Data • Sensitivity: The probability of the test finding disease among those who have the disease or the proportion of people with disease who have a positive test result. Sensitivity = true positives / (true positives + false negatives)
Sensitivity and Specificity in Qualitative Data • Specificity: The probability of the test finding NO disease among those who do NOT have the disease or the proportion of people free of a disease who have a negative test. Specificity = true negatives / (true negatives + false positives)
Sensitivity and Specificity • Distinction between quantitative (or continuous) and qualitative (or discrete) is somewhat artificial • Often, have a quantitative measure that is converted to a qualitative measure using a cutoff value • Moving that cutoff value greatly influences sensitivity and specificity
Sensitivity and Specificity TN = true negative TP = true positive FN = false negative FP = false positive
Sensitivity and Specificity TNF = true negative fraction TPF = true positive fraction FNF = false negative fraction FPF = false positive fraction http://www.anaesthetist.com/mnm/stats/roc/
Sensitivity and Specificity(for reference later) • Sensitivity: The probability of the test finding disease among those who have the disease or the proportion of people with disease who have a positive test result. Sensitivity = true positives / (true positives + false negatives) • Specificity: The probability of the test finding NO disease among those who do NOT have the disease or the proportion of people free of a disease who have a negative test. Specificity = true negatives / (true negatives + false positives) • Positive Predictive Value (PPV): The percentage of people with a positive test result who actually have the disease. Positive predictive value = true positives / (true positives + false positives) • Negative Predictive Value (NPV): The percentage of people with a negative test who do NOT have the disease. Negative predictive value = true negatives / (true negatives + false negatives)
Sensitivity and SpecificityExamples from AddHealth Sensitivity = 665 673 = 0.9881 Specificity EIA only = 2880 2897 = 0.9941 Specificity EIA & WB = 2893 2897 = 0.9986
Sensitivity and Specificity • AddHealth HIV tests have sensitivity of 98.80% and specificity of 99.86%. Now what? • Sensitivity = 665 673 = 0.9881 • 8 sick people told they are well • Specificity EIA only = 2880 2897 = 0.9941 • 17 well people told they are sick • Specificity EIA & WB = 2893 2897 = 0.9986 • 4 well people told they are sick
Sensitivity and Specificity Number of true positives and false positives is related to disease prevalence. In the example below, the test has 95% sensitivity and 95% specificity. All the parameters stay the same, except the prevalence.