Download
1 / 31
310 likes | 448 Vues
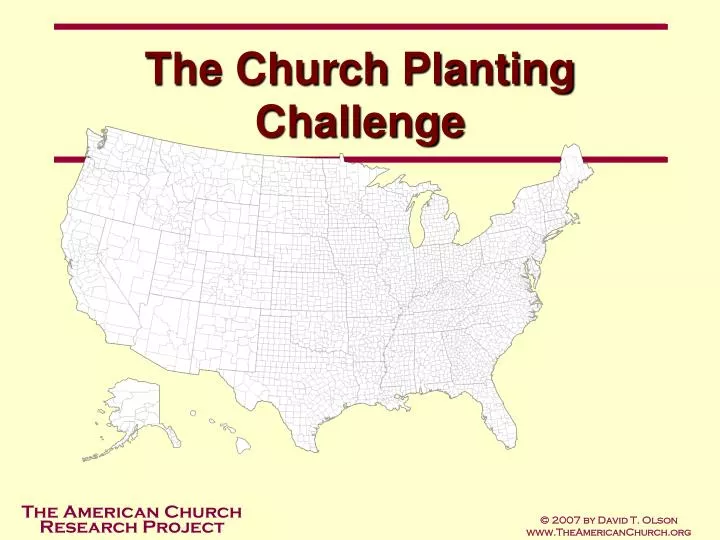
The Church Planting Challenge. There are 91,384,566 new people in the United States today who were not here in 1990. This includes 68,510,978 babies born in the U.S. and 22,873,578 new immigrants. 1990 - 2006 Population Growth by Birth, Immigration, and Death. 91,384,556. 68,510,978.

E N D
The Church PlantingChallenge © 2007 by David T. Olson www.TheAmericanChurch.org
There are 91,384,566 new people in the United States today who were not here in 1990. This includes 68,510,978 babies born in the U.S. and 22,873,578 newimmigrants. © 2007 by David T. Olson www.TheAmericanChurch.org
1990 - 2006 Population Growth by Birth, Immigration, and Death 91,384,556 68,510,978 51,773,556 22,873,578 Deaths Births Net Immigrants Total New People Net Gain in Population -39,611,000 © 2007 by David T. Olson www.TheAmericanChurch.org
The percentage of people attending a Christian church each weekend decreased significantly from 1990 to 2006. • Numbers from actual counts of people in orthodox Christian churches show that 20.6 percent of the population attended church on any given weekend in 1990. That percentage dropped to 18.7 percent in 2000and to 17.3 percent in 2006. • The percentage attending mainline and Catholic churches declined more quickly from 2000 to 2005 than it did in the 1990s, while the evangelical percentage declined only slightly. The Catholic Church’s decline in attendance percentage occurred even though its membership numbers are keeping up with population growth. © 2007 by David T. Olson www.TheAmericanChurch.org
The rate of church attendance growth has been declining over the past 16 years. The next slide shows the net yearly numeric gain of evangelical churches on any given weekend. It shows the yearly gain or decline in attendance from 1990-1999, 2000-2005, and 2005-2006. (Data does not factor in population growth.) The following two slides show the increased decline in mainline and Catholic churches. © 2007 by David T. Olson www.TheAmericanChurch.org
Which is the only state for which the rate of church attendance grew faster than the population during this decade? © 2007 by David T. Olson www.TheAmericanChurch.org
Growth or Decline in the Percentage of the Population Attending Christian Churches from 2000 - 2006 -16.5% -4.2% NH WA -11.9% -10.5% -3.5% -6.5% ME -6.5% MT VT ND MN -9.5% OR -14.0% MA -5.4% -10.8% -13.5% -10.2% WI ID NY SD -7.8% -5.4% -14.1% WY MI RI -7.2% -5.9% -13.1% -6.2% PA IA CT NE -5.8% -11.2% -2.5% OH NJ -9.5% -4.3% -3.2% -7.1% NV DC -4.5% IN -3.9% UT IL -7.8% CA -2.6% -3.1% CO WV -3.4% -4.6% DE VA -1.6% KS MO KY -5.4% -3.5% -2.0% MD NC TN -0.3% -7.5% -11.2% OK -0.4% AZ -2.5% NM AR SC -4.9% -0.5% GA -3.3% Decline AL MS Growth -6.0% -5.8% TX LA -8.3% AK -8.6% FL 2.0% HI © 2007 by David T. Olson www.TheAmericanChurch.org
The following slide shows a map of evangelical church attendance from 2000-2006. Notice the results of the southern states from North Carolina to Texas. Fifty percent of evangelical attendance is from the south. © 2007 by David T. Olson www.TheAmericanChurch.org
Growth or Decline in the Percentage of the Population Attending Evangelical Churches from 2000 - 2006 1.9% 1.2% NH WA 0.2% 9.6% 1.2% -2.4% ME 3.6% MT VT ND MN -3.1% OR 4.6% MA -0.4% 1.4% -1.9% -0.6% WI ID NY SD -1.7% -0.8% 9.5% WY MI RI 3.2% 3.0% 0.3% -4.2% PA IA CT NE 1.4% 2.3% 4.5% OH -15.2% NJ 1.4% 4.1% -1.3% NV DC 0.0% IN 2.8% UT IL 1.0% CA -3.8% 0.1% CO WV 4.0% 0.4% DE VA 1.3% KS MO KY 1.7% -3.4% -1.0% MD NC TN 1.6% 1.1% -7.6% OK -0.2% AZ -1.4% NM AR SC -3.3% -0.7% GA -2.3% Decline AL MS Growth -3.0% -0.5% TX LA -4.5% AK -2.5% FL 7.7% HI © 2007 by David T. Olson www.TheAmericanChurch.org
Established churches are declining in attendance by one to two percent each year. The next slide shows the growth rate of Protestant churches based on the year they were started. On average, once churches enter their second generation of life (more than 40 years old), they consistently decline. © 2007 by David T. Olson www.TheAmericanChurch.org
2004-2005 Growth by Decade Started 10.0% 8.0% 6.0% 4.0% 2.0% 0.0% -2.0% -4.0% 1970s 1980s 1990s 2000s 1800s 1810s 1820s 1830s 1840s 1850s 1860s 1870s 1880s 1890s 1900s 1910s 1920s 1930s 1940s 1950s 1960s pre-1800 © 2007 by David T. Olson www.TheAmericanChurch.org
The next slide shows the growth rate of evangelical churches from 1999-2000, sorted by size. The following slide shows the growth rate of evangelical churches from 2005-2006, sorted by size. The third slide shows the differential change. © 2007 by David T. Olson www.TheAmericanChurch.org
1990-2000 Evangelical Percentage Attendance Growth by Size of Church 6.0% 5.1% 5.0% 4.0% 4.0% 3.0% 2.0% 0.8% 0.6% 0.5% 1.0% 0.1% 0.2% 0.0% -0.1% -0.4% -0.6% -1.0% -2.0% -3.0% 1-49 50-99 100-149 150-199 200-299 300-399 400-499 500-999 1000-1999 2000+ 1999 Attendance © 2007 by David T. Olson www.TheAmericanChurch.org
2005-2006 Evangelical Percentage Attendance Growth by Size of Church 6.0% 5.3% 5.0% 4.0% 3.0% 2.3% 2.0% 0.5% 1.0% 0.4% 0.0% -0.2% -0.7% -1.0% -0.9% -0.9% -1.3% -1.3% -2.0% -3.0% 1-49 50-99 100-149 150-199 200-299 300-399 400-499 500-999 1000-1999 2000+ 2005 Attendance © 2007 by David T. Olson www.TheAmericanChurch.org
2000-2006 Evangelical Attendance Growth Differential by Size of Church 0.4% 0.5% 0.2% 0.0% -0.2% -0.3% -0.5% -0.7% -0.8% -0.9% -0.8% -1.0% -1.5% -1.7% -2.0% -2.1% -2.5% -3.0% 1-49 50-99 100-149 150-199 200-299 300-399 400-499 500-999 1000-1999 2000+ © 2007 by David T. Olson www.TheAmericanChurch.org
The percentage of evangelical attendance coming from new churches was increasing until 2000. The percentage of a denomination’s attendance from churches started in the last 10 years is the best way to evaluate a group’s church planting effectiveness. © 2007 by David T. Olson www.TheAmericanChurch.org
Evangelical Percentage of Attendance from Churches Under 10 Years Old 8.0% 7.5% 7.4% 7.4% 7.5% 7.3% 7.1% 6.7% 7.0% 6.2% 6.0% 5.0% 4.0% 3.0% 2.0% 1.0% 0.0% 1990 1995 1999 2000 2001 2002 2003 2004 © 2007 by David T. Olson www.TheAmericanChurch.org
Average Attendance at New Churches The average attendance of an individual new church increased from 1990-2000, but it has declined in recent years. The recent decline can most likely be attributed to ‘emerging churches’ being smaller than the earlier ‘boomer churches’ and more small ethnic churches being planted. © 2007 by David T. Olson www.TheAmericanChurch.org
Average Weekend Attendance from Churches Less Than 10 Years Old 96.5 97.0 96.0 94.5 94.6 95.0 94.0 93.0 92.4 92.4 92.1 91.9 92.0 91.0 90.0 89.0 1990 1999 2000 2001 2002 2003 2004 © 2007 by David T. Olson www.TheAmericanChurch.org
Is the number of new churches started each year growing? The next slide shows the number of new churches started each year in the 1990s and the 2000s. Because the decline rate of established churches is not likely to change, in order to keep the church in America growing at the rate of the population we would need to start 2,300 new churches each year. © 2007 by David T. Olson www.TheAmericanChurch.org
New Churches Started Each Year 4,090 4,100 4,000 3,900 3,800 3,600 3,700 3,600 3,500 3,400 3,300 1990s 2000-2005 © 2007 by David T. Olson www.TheAmericanChurch.org
The future of the church in America The next slide shows data and projections for the percentage of the population attending a Christian church weekly from 1990-2020. The number of Americans attending will decline only slightly, but the percentage will decline more significantly. © 2007 by David T. Olson www.TheAmericanChurch.org
Percentage of the Population Attending a Christian Church Each Weekend 25.0% 20.6 19.6 18.7 20.0% 17.5 16.5 15.5 14.7 15.0% 10.0% 5.0% 0.0% 1990 1995 2000 2005 2010 (est) 2015 (est) 2020 (est) © 2007 by David T. Olson www.TheAmericanChurch.org
Information on Data • The spiritual health of churches is multifaceted and is obviously much more complex than an attendance trend can portray. However, following the example of Luke in the Book of Acts, who used the number of people who showed up at various events as a sign documenting the health and growth of the early church, I would suggest that attendance is the single most helpful indicator of health, growth, and decline. • Information has been compiled only for orthodox Christian groups: Protestant, Catholic, and Orthodox. The Mormons, Jehovah’s Witnesses, Unitarian Universalists and the International Churches of Christ have not been included. In addition, information about nonChristian groups has not been compiled. • African American denominations publish very little that is statistical—often not even a list of current churches. This study used data from the 1990 Glenmary Study on black Baptist estimates and AME Zion churches, the average African American worship attendance (from the Barna Research Group), and a statistical model based on the population of African Americans in each county in 1990 and 2000. This was combined with the known attendance at about 10,000 African American churches to come up with as accurate an estimate as possible for each county. © 2007 by David T. Olson www.TheAmericanChurch.org
Information on Data • Independent church data is difficult to obtain. (There are actually many fewer totally independent churches than is assumed. Most are part of some voluntary association, which typically keeps some records.) Data from the 1990 and 2000 Glenmary Study on larger independent churches (limited to those with more than 300 in attendance) was used along with a statistical model to estimate the attendance at smaller independent churches. • In Catholic churches, the definition of what constitutes membership varies with diocese and church, making numbers sometimes inconsistent from state to state and county to county. In addition to actual mass counts from one third of Catholic parishes, membership information has been merged with attendance patterns from similar dioceses based on the size of the diocese and the region in which it is located. • Orthodox churches are included in totals, but are not included as a separate group because of smallness of size nationwide. Division into evangelical and mainline categories is based on the division by the Glenmary Study. • This study only looks at how many people attend a Christian church on any given Sunday. The term “regular attendee” can be understood to mean someone who attends a Christian church on a consistent basis. Using a simple definition for “regular attendee” (attends at least 3 out of every 8 Sundays), between 22 and 24 percent of Americans fit this category. Adding “regular attendees” of non-orthodox Christian churches and other religions to the totals would increase the percentage to 25 to 27 percent. © 2007 by David T. Olson www.TheAmericanChurch.org
This presentation is based on a nationwide study of American church attendance as reported by churches and denominations. The database currently has average worship attendance numbers for each of the past 15 years for more than 200,000 individual churches. It also uses supplementary information (actual membership numbers correlated with accurate membership to attendance ratios) to project the attendances of all other denominational and independent churches. Accurate information is provided for all 305,000 orthodox Christian churches. © 2007 by David T. Olson www.TheAmericanChurch.org
For More Information Presentations such as this one are available for the largest 90 metropolitan areas in the United States, for each state, and for the nation. Presentations can be downloaded immediately. A combo pack including the national, state, and any metro PowerPoints from that state is also available for each state. Please visit www.theamericanchurch.org for ordering information. © 2007 by David T. Olson www.TheAmericanChurch.org