Download
1 / 22
220 likes | 376 Vues
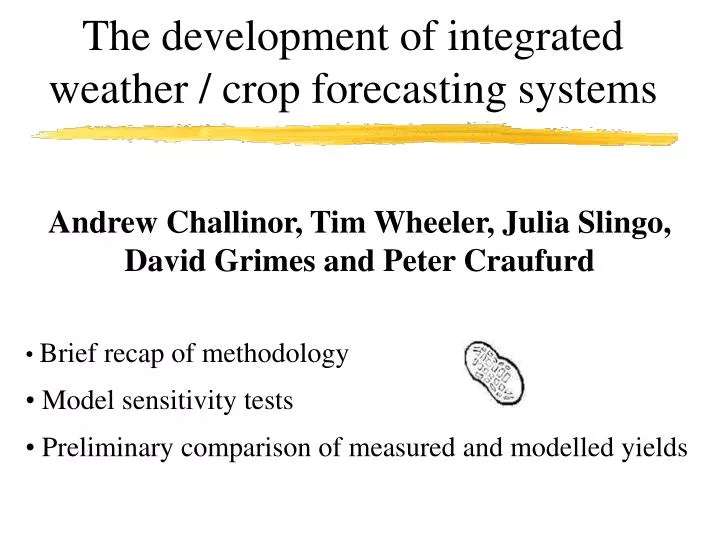
The development of integrated weather / crop forecasting systems. Andrew Challinor, Tim Wheeler, Julia Slingo, David Grimes and Peter Craufurd Brief recap of methodology Model sensitivity tests Preliminary comparison of measured and modelled yields. Methodology.

E N D
The development of integrated weather / crop forecasting systems • Andrew Challinor, Tim Wheeler, Julia Slingo, David Grimes and Peter Craufurd • Brief recap of methodology • Model sensitivity tests • Preliminary comparison of measured and modelled yields
Methodology Find spatial scale(s) of weather-crop relationships Probabilistic forecasting Crop modelling at the working spatial scale Hindcasts with observed weather data
The weather / yield relationship for the case of groundnut in India Correlation coefficient for seasonal total rainfall and groundnut yield in India, 1966-1990
Empirical Orthogonal Function (EOF) analysis First EOF of sub-divisional yield (23.4% of variance) Yield anomaly for 1985
Empirical Orthogonal Function (EOF) analysis First EOF of sub-divisional rainfall (36.5% of variance)
Correlation between patterns of seasonal rainfall and yield First principal component of rainfall yield R2=0.53
Correlation between patterns of seasonal rainfall, yield and circulation First principal component of rainfall yield and PC3 of 850hPa circulation r2(circ,yield)=0.45
Country + district field Spatial scale annual + seasonal monthly daily GCM Timescale Crop models
Country + district field Spatial scale annual + seasonal monthly daily Timescale rainfall groundnut Sub-grid var Sub-seasonal variability
Country + district field Spatial scale annual + seasonal monthly daily Timescale rainfall groundnut Large area model
Data for model validation FAO 0.5 deg. soils data Daily gridded IITM rainfall data and IITM regional Tmax, Tmin CRU 0.5 deg. T, R, e or
Optimisation of global parameters Merit Fn.
Comparison of mean yields Modelled Measured
Comparison of Standard deviation Measured Modelled
Measured and modelled yields in West Gujarat • Good overall agreement (r2=0.66) (c.f. 0.54 correlation with rainfall) • Potential yield also captures some of the variability • Again first half better (r2=0.88) Data Pot. Model Model
Regional variability in model performance Merit Fn. Relative sowing date Black = first half (66-77) Red = second half (78-89) Green = 66-89 => Detrending method is important in some regions Also: Irrigated fraction, spatio-temporal variation in yield gap, poor rainfall-yield correlations
EOF analysis of model output The First PC of modelled yield correlates with the first PC of both rainfall (r2=0.79) and measured yield (r2=0.41 and 0.76 for the first half only)
EOF analysis of monthly data June, 40% October, 49%
Integrated weather/ crop forecasting system General Circulation Model Regional climate model weather forecast spatial parameters Crop model model uncertainties Large area model crop forecast output processing