Download
1 / 32
320 likes | 450 Vues
Nuclear Physics. Discovery of the Nucleus. Prior to 1911, the atom was thought to be like a “plum pudding”, with its positive charge spread out through the entire volume of the atom (the “pudding”), and the electrons (the “plums”) vibrating at fixed points within this sphere of charge.

E N D
Discovery of the Nucleus • Prior to 1911, the atom was thought to be like a “plum pudding”, with its positive charge spread out through the entire volume of the atom (the “pudding”), and the electrons (the “plums”) vibrating at fixed points within this sphere of charge. • Ernest Rutherford showed via simple experiment that the atom could not be structured like this at all, but rather had all its positive charge concentrated in a tiny nucleus, approximately 104 times smaller than the atom itself. • Rutherford fired energetic -particles (Helium nuclei) at a thin piece of gold foil, and measured the extent to which they were deflected as they passed through. • He found that most of the -particles were deflected through small angles, but a small fraction of them were scattered through very large angles approaching 180°! In Rutherford’s words “it was as if a 15-inch shell was fired at a piece of tissue paper and it came back and hit you!”. Alpha source Gold foil Detector
Discovery of the Nucleus • Rutherford deduced that the maximum deflecting force that could act on an -particle as it passed through an atom with a ‘plum pudding’ type charge distribution, would be far too small to deflect it by even as much as 1 degree. The only way such a large (180°) deflection could take place was to have all the positive charge concentrated tightly at the atom’s centre. In that way the incoming -particle could get very close to it and in doing so experience the full force of the charge. How close?? Consider a 5.30MeV -particle (that has a charge of +2e) that heads directly towards the nucleus of an atom of gold (which has a charge of +79e). The repulsive force the -particle feels from the gold nucleus will cause it to come to rest, or in other words, its kinetic energy will be converted into electrostatic potential energy, with: 5.30 MeV = (1/40)(QQAu/d) putting in the appropriate numbers gives d = 4.29 x 10⁻¹⁴m, which is about 10-4 x smaller than size of atom it is mostly empty space!!
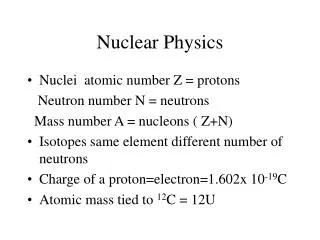
Nuclear Properties • Some nuclear terminology • Nuclei are made up of protons and neutrons. • The number of protons is called the atomic number or proton number and is represented by the symbol Z. • The number of neutrons is called the neutron number and is represented by the symbol N. • The total number of neutrons and protons in a nucleus is called its mass number A, where A = Z + N. • Nuclides with the same atomic number Z but different neutron numbers N are called isotopes. • As an example, the element gold has 30 isotopes ranging from 175Au to 204Au. Only one of them, 197Au, is stable; the remaining 29 are radioactive, decaying by the spontaneous emission of a particle, with average lives ranging from seconds to a few months.
Nuclear Properties • Distribution of nuclides in the Z-N plane • It is interesting to examine where naturally occurring nuclides – both stable and radioactive – lie in a plot of atomic number (Z) versus neutron number (N). • The stable nuclides are represented by the green data points – they are seen to lie in a well-defined central band. • The radionuclides (radioactive nuclides) tend to lie on either side of and at the upper end of the band defined by the stable nuclides (light-orange shading).
Nuclear Properties • Nuclear Radii • A convenient unit for measuring the sizes of atomic nuclei is the femtometer (=10-15m) or fermi (shortened to fm). • The size and structure of nuclei is best determined by bombarding them with high-energy electrons and observing the way the nuclei deflect them. The energy of the electrons must be ~200MeV in order for them to be structure-sensitive probes. • Such experiments show that the nucleus has a characteristic mean radius R given by: • R = RoA⅓, • where A is the mass number and Ro ~ 1.2fm. • Nuclear masses • These are measured in atomic mass units, u, chosen so that the atomic mass of 12C is exactly 12u. 1u = 1.661 x 10⁻²⁷ kg.
Nuclear Properties • Nuclear Binding Energies • When the masses of nuclei are measured with great precision (via mass spectrometry), it is found that they are slightly smaller than the value derived by summing the masses of the individual protons and neutrons in the nuclei. This is called the “mass defect” (m). • The energy associated with this mass defect, E = mc2, is what binds the nucleus together, and is called the nuclear binding energy. It can also be thought of as the total energy required to tear a nucleus apart into its constituent protons and neutrons. • If we divide the binding energy of a nucleus by its mass number, we get the binding energy per nucleon. • The figure on the next slide shows a plot of the binding energy per nucleon versus mass number (A) for the various nuclides.
Binding Energy • We see that the binding energy per nucleon curve rises sharply with increasing A, in the range 2<A<12, and then flattens off to reach a peak at 56<A<81. This range in A is the region of greatest stability, where nuclei have the highest possible binding energy per nucleon. • The binding energy curve then shows a gradual decline in going to higher A values beyond the peak region.
Binding Energy • This behavior means that it is energetically favorable for nuclides at the low A end to fuse into higher mass nuclei nuclear fusion. • It also means that it is energetically favourable for nuclides at the high A end to split into smaller nuclei nuclear fission.
Nuclear Force • Since the nucleus contains positively charged protons (as well as neutral neutrons), it must be bound together by a very different force to the electromagnetic force that binds electrons to the nucleus. • It must be a strongly attractive force that overcomes the electromagnetic repulsion between the protons, and contains all the protons and neutrons in such a small volume. It must also be short range, since its influence is known not to extend far beyond the nuclear ‘surface’. • This force is called the nuclearstrong force which binds the constituents of neutrons and protons – quarks – together.
Radioactive Decay • As we have seen from the figure shown in slide 5, a significant fraction of nuclides are radioactive (as indicated by the light-orange shading): that is, a nucleus will spontaneously emit a particle, thereby transforming itself into a different nuclide. This is a completely statistical process in that there is no way to predict whether and when a nucleus will decay; rather all we can do is talk about the chance of it happening. • The statistical nature of the decay can, however, be expressed mathematically, in that if a sample contains N radioactive nuclei, then the rate at which nuclei decay is proportional to N: • -dN/dt = N • where is the disintegration constant which has a characteristic value for every radionuclide. • Integrating the above decay equation gives: • N = N0e-t • where N0 is the number of radioactive nuclei in the sample at t=0 and N is the number remaining at any subsequent time t.
Radioactive Decay • It is often the case that the actual decay rate R (=-dN/dt) is of most interest, and we can derive this by differentiating the previous equation: • R = -dN/dt = N0e-t = R0e-t • where R0= N0is the initial decay rate at t=0. The decay rate R is also referred to as the activity of the radionuclide. • R is measured in disintegrations per second, or counts per second (as measured by a Geiger counter), or in curies (Ci) where 1 Ci = 3.70 x 10¹⁰ disintegrations per second. The half-life of a radioactive nucleus is defined as: the time after which both N and R are reduced to one-half their initial values. • Putting R = ½ R0in the above equation and substituting for t, we have: • ½ R0 =R0e- • and solving for yields: • = (ln 2)/
Radioactive Dating • If the half-life of a given radionuclide is known, then in principle it can be used as a clock to measure a time interval radioactive dating. • This is best understood by working through the following example: Q. Analysis of potassium and argon atoms in a moon rock shows that the ratio of the number of stable 40Ar atoms present to the number of radioactive 40K atoms is 10.3. Assume that all the argon atoms were produced by the decay of potassium atoms, with a half-life of 1.25x10⁹ yrs. How old is the rock? A. If N0 potassium atoms were present at the time the rock was formed, the number of potassium atoms remaining at the time of analysis is: NK = N0e-t where t is the age of the rock. For every potassium atom that decays, an argon atom is produced. Hence the number of argon atoms present is: NAr = N0 - NK
Radioactive Dating We cannot measure N0, so we need to eliminate it from the equations: t = ln (1 + NAr/NK). Solving for t and replacing with (ln 2)/, we get: t = [ ln (1 + NAr/NK)]/ln 2 = [1.25 x 10⁹][ln (1+10.3)]/ln 2 = 4.37 x 10⁹ yrs
Alpha Decay • Nuclear decay occurs, sooner or later, whenever a nucleus containing a certain number of nucleons resides in an energy state which is not the lowest possible one for a system with that number of nucleons. • Nuclear decay divides itself into 3 categories: -decay, -decay and -decay. The first of these, -decay, involves the spontaneous emission of an particle (that is, a Helium nucleus 2He) from a nucleus of large atomic number (Z>82). • This decay takes place spontaneously because it is energetically favoured, the mass of the parent nucleus being greater than the mass of the daughter nucleus plus the mass of the particle. The reduction in nuclear mass in the decay is primarily due to a reduction in the Coulomb energy of the nucleus when its charge Ze is reduced by the charge 2e carried away by the particle. • The energy made available in the decay is the energy equivalent of the mass difference, and it is carried away by the particle. As confirmed by experiment, all the particles emitted in the decay of a particular species have the same unique kinetic energy = (mass difference)c2. 4
Alpha Decay • This -decay energy, E, can be written in terms of the atomic masses of the parent, daughter, and particle nuclei: • E = [MZ,A – (MZ-2,A-4 + M2,4)]c2 • Note that the -decay energies range from 8.9MeV to 4.1MeV. Illustrative example: an particle is emitted by the parent nucleus 84Po. Estimate the Coulomb potential it feels at the nuclear surface and plot the sum of the Coulomb and nuclear potentials acting on the particle in various locations. Solution: if we approximate the daughter nucleus and the particle as uniformly charged spheres, the Coulomb repulsion potential energy when they are just touching will be: Vo = + 2Ze2/4or’ Where +2e is the particle charge, +Ze is the daughter nucleus charge, and r’ is the sum of the radii of the particle and daughter nucleus (which in this case = 8.0F). 212
decay example continued: So we have Vo = [2 x 82 x (1.6 x 10-19)2]/[1.1 x 10-10 x 8.0 x 10-15] = 4.8 x 10⁻¹² J = 30 MeV • The plot shows the total (Coulomb + nuclear) potential acting on the particle. As it approaches the nucleus, it feels the repulsive Coulomb potential increasing in inverse proportion to the separation between the centres of the particle and nucleus, and reaches a value of Vo when this distance equals r’. • Inside the surface it feels a rapid onset of the strong attractive nuclear potential. • Also indicated is the -decay energy, E=8.9MeV, which is the energy of the emitted particle. • The E value is considerably smaller than the height of the Coulomb barrier, which is 30MeV; classically, the particle would appear trapped inside the barrier, but is able to escape through the process of quantum tunneling.
Alpha Decay and the Z-N diagram -decay involves a loss of 2 protons and 2 neutrons, and hence causes nuclei to move diagonally downwards in the Z-N diagram, allowing radioactive nuclei to migrate down to the stable zone (green band)
Beta Decay • There are three different -decay processes: • Electron emission – where a negatively charged electron is emitted by the nucleus, so Z increases by one, N decreases by one, and A remains fixed (effectively n e- + p within nucleus) • Electron capture – where a nucleus captures a negatively charged electron, and Z decreases by one, N increases by one, and A remains fixed (effectively p + e- n) • Positron emission – where a nucleus emits a positively charged electron, and Z decreases by one, N increases by one, and A remains fixed (effectively p e+ + n) • Conditions for each of these forms of -decay to occur: • E = [mZ,A – (mZ+1,A + me)]c2 > 0 • E = [(mZ,A + me) – mZ-1,A]c2 > 0 • E = [mZ,A – (mZ-1,A + me)]c2 > 0 me = electron mass Mass defect
Beta Decay • Experimental studies of -decay show that the electrons (either positive or negative) that are emitted, have a broad spectrum of kinetic energies, Ke, as shown in the figure. Initially, this was a very mysterious and disturbing result, since you would expect the electron to carry away all the decay energy associated with this process (i.e. given by the E value equations on the previous page). Where did the missing energy go? • Problem solved by Pauli in 1931, who postulated that a particle, now called the anti-neutrino, is also emitted in the -decay process, but is not normally detected because its interaction with matter is extremely weak.
Beta Decay and the Z-N diagram • -decay causes nuclei to move diagonally upwards or downwards as shown, and hence allows radioactive nuclei at intermediate values of N and Z to migrate towards the stable zone. positron emission & electron capture electron emission
- and -decay in the Z-N diagram • In reality, it is the combination of successive - and -decays that allow nuclei to migrate to the stable zone.
Often nuclear decay is accompanied by the emission of a -ray, which is a photon that carries away the energy released when a nucleus makes a transition from a higher excited state to a lower excited state. • An example is shown in the diagram where the parent nucleus undergoes -decay to one of three different energy levels of the daughter nucleus (the lowest being the ground state). Where the decay is to one of the two excited states, it is followed by -ray emission, as the daughter nucleus drops down to the lower energy states. • IMPORTANT: -rays typically have energies of several MeV (highly energetic!), since this is the separation between the different energy levels of the nucleus. Gamma Decay E (MeV) parent 5 4 3 2 1 0
Nuclear Fission • In 1932, James Chadwick discovered the neutron. Subsequently, physicists realised that this particle was a very useful nuclear projectile, since being neutral, it had no Coulomb barrier to overcome as it approached the nucleus. They had particular success in producing new, lower mass nuclei by bombarding uranium salts with neutrons. • A typical fission event is seen in the case of 235U, which can absorb a neutron, producing 236U in a highly excited state. This nucleus undergoes fission, splitting into two fragments 140Xe and 94Sr, which each rapidly emit a neutron: • 235U + n 236U* 140Xe + 94Sr + 2n • The fragments 140Xe and 94Sr are both highly unstable and undergo -decay (with the emission of an electron) until each reaches a stable end product: • 140Xe 140Cs 140Ba 140La 140Ce • 94Sr 94Y 94Zr
Nuclear Fission and its applications • We see from the previous example of 235U fission, for every single neutron that is required to trigger the process, two neutrons are produced by it. • Hence the process is self-sustaining since these neutrons are capable of triggering further fission events creates a CHAIN REACTION. • This chain reaction, plus the release of energy associated with each fission event: • disintegration energy, Q (for fission of 235U) = 209MeV (LARGE!!) • it can be used as the basis for a nuclear bomb (where process happens rapidly) or a nuclear reactor (where process is kept under control and made to occur slowly).
Nuclear Fusion • We have already seen from examination of the binding energy curve for nuclides that it is energetically favourable for two light nuclei to combine to form a single larger nucleus a process called nuclear fusion. • However, the process is hindered by the Coulomb ‘barrier’ that the nuclei have to surmount in order to overcome the repulsion between them due to each having a positive charge. Reminder: the Coulombic potential energy associated with this repulsion is given by V=(1/4o)(e2/r)Z1Z2, where Z1 and Z2 are the proton numbers of each nuclei, and r is their separation. When just touching, r is typically several Fermis (~ 10-15m), and V~200(Z1Z2)keV. The nuclei need kinetic energies of this order to overcome the Coulomb barrier. • When the temperature is high enough that the thermal motions of the nuclei alone are sufficient to penetrate the Coulomb barrier, then thermonuclear fusion takes place.
Nuclear Fusion How high does the temperature have to be? Energy associated with thermal motion, K~kT (k = Boltzmann’s constant = 1.38 x 10⁻²³ J/K). So if K ~ 200keV T ~ (200 x 103 x 1.6 x 10-19)/1.38x10-23 ~ 2.32 x 10⁹ K • A place which might be hot enough for thermonuclear fusion to take place is at the centre of a star. However, taking the Sun as an example, it would at first glance appear not to be hot enough with T(centre)~107 K. But we do know that the Sun is in fact powered by the thermonuclear conversion of hydrogen into helium at its centre – why is this so? • The above calculation refers to a mean or most probably energy, whereas the gas at the centre of the Sun has a Maxwellian distribution of energies, with a long tail which extends to much higher values. • The barrier heights that have been calculated represent peak values and barrier tunneling can occur at energies significantly below these values.
Thermonuclear fusion in the Sun • The Sun radiates energy at the rate of 3.9 x 1026 W and has been doing so for 4-5 billion years. It is impossible to explain this rate of energy output over such a long period by non-nuclear processes: • Chemical burning – e.g., combustion of coal and oxygen, would only last for ~1000 years; • Conversion of gravitational potential energy to thermal energy – solar lifetime too short by a factor of ~ 500. • Instead, the Sun is powered by thermonuclearfusion in which hydrogen is burned into helium via a multi-step process called the proton-proton (p-p) cycle. The various steps are as follows: • 1H + 1H 2H + e+ + (Q=0.42MeV) [x2] • e+ + e- + (positron-electron annihilation, Q=1.02MeV) [x2] • 2H + 1H 3He + (Q = 5.49MeV) [x2] • 3He + 3He 4He + 1H + 1H (Q = 12.86MeV) • Q(total) = 2(0.42+1.02+5.49) + 12.86 = 26.7 MeV
Thermonuclear fusion in the Sun • The Sun radiates energy at the rate of 3.9 x 1026 W and has been doing so for 4-5 billion years. It is impossible to explain this rate of energy output over such a long period by non-nuclear processes: • Chemical burning – e.g., combustion of coal and oxygen, would only last for ~1000 years; • Conversion of gravitational potential energy to thermal energy – solar lifetime too short by a factor of ~ 500. • Instead, the Sun is powered by thermonuclearfusion in which hydrogen is burned into helium via a multi-step process called the proton-proton (p-p) cycle. The various steps are as follows: • 1H + 1H 2H + e+ + (Q=0.42MeV) [x2] • e+ + e- + (positron-electron annihilation, Q=1.02MeV) [x2] • 2H + 1H 3He + (Q = 5.49MeV) [x2] • 3He + 3He 4He + 1H + 1H (Q = 12.86MeV) • Q(total) = 2(0.42+1.02+5.49) + 12.86 = 26.7 MeV solar neutrino
Thermonuclear fusion in the Sun • Important notes: • The first step in the process where two protons collide to successfully form a deuteron is extremely rare (a 1 in 1026 chance!!); hence this step provides a ‘bottle-neck’ which regulates the thermonuclear process in the Sun (and stars in general). • In spite of this bottle-neck, there are so many protons undergoing collisions, that 1012 kg of deuterium is produced in this way each second! • Overall, the p-p cycle amounts to the combination of 4 protons and 2 electrons to form an -particle, 2 neutrinos, and 6 -rays.
The Solar Neutrino Problem • We see that step 1. of the p-p cycle produces a neutrino, and hence the thermonuclear fusion taking place at the centre of the Sun produces a steady stream of neutrinos which travel unhindered from the Sun’s core to the Earth (and through it!). • However, the number of neutrinos detected on Earth is found to be between ⅓ and ½ the number predicted from theoretical calculations. • Unlikely that the observations were wrong; instead either the models of the Sun were wrong or the models of neutrino behaviour (and hence the “standard model of physics”) were wrong SOLAR NEUTRINO PROBLEM! • This problem remain unsolved for about 40 years, until 2002 when it was shown by the Super-Kamiokande and Sudbury Neutrino Observatories that the neutrino actually had a mass. • This was in contradiction to the Standard Model of Particle Physics where neutrinos have zero mass, and the relative fractions of the different types – electron-neutrino, muon-neutrino, and tau-neutrino – were invariant.
The Solar Neutrino Problem • It was known from theory that if neutrinos did have mass, then they could change from one type to another NEUTRINO OSCILLATIONS. In particular the electron-neutrinos, which are the type produced by the p-p cycle in the Sun and the only type that could be detected by the neutrino observatories like Super-Kamiokande and Sudbury, can change into the other two types (muon and tau) during their journey from the Sun to the Earth. • Hence the solar neutrino problem was solved, with theoretical calculations showing that with neutrino oscillations, the number of electron-neutrinos expected to be observed is ~35% of the number that leave the Sun, consistent with experiment.