Download
1 / 41
410 likes | 553 Vues
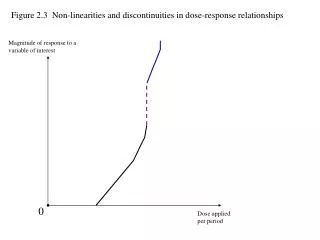
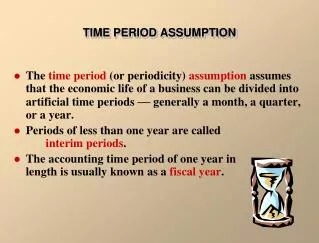
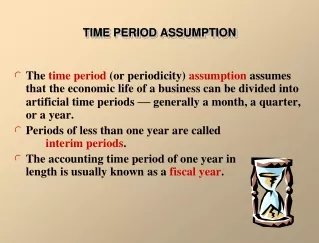
Why these shapes? Relationships between costs?. $ per time period. MC. ATC. AVC. AFC. Q. Q. Q. 1. 2. 3. Output per time period (units). (. b. ) Unit costs. Chapter 6 Market Structure I: Perfect Competition. Market Structure Perfect Competition Vs Monopoly

E N D
Why these shapes? Relationships between costs? $ per time period MC ATC AVC AFC Q Q Q 1 2 3 Output per time period (units) ( b ) Unit costs
Chapter 6Market Structure I:Perfect Competition • Market Structure • Perfect Competition Vs Monopoly • What determines the level of competition? • Perfect Competition in Detail
Market Structure • Competitive environment for a good or service • Market – all firms and individuals willing and able to buy or sell a particular product
Factors that determine the level of competition • Product Differentiation • Barriers to Entry • Number of Buyers and Sellers • Information availability
Types of Markets • Perfect Competition • Monopoly • Monopolistic Competition • Oligopoly
Perfect Competition • Large number of buyers and sellers – each firm produces small amount of industry supply and each customer buys a small part of the total. • Product Homogeneity – Output of each firm is essentially the same. • Free Entry – firms are not restricted from entering the market. • Perfect Information – costs, prices and quality is know by all buyers and sellers • Buyers and Sellers are “price takers” as they can’t influence the price, must take as given (market price). • An Extreme? • Practical Examples?
GE Stock • Individual has 1000 shares of GE common stock • 9.93 Billion shares outstanding • Value of stock is obtained from broker (or internet) • Market determines price, can sell or buy as many as you want at this price. • Can’t sell any above the price or buy any below the price. • Buyers and Sellers are Price Takers!
Milk Market • No single buyer can influence price • Seller has little price control as products are exactly the same as their competition • Can sell all you want at market price – little incentive to charge less – charge more buyers substitute • Buyers and sellers take market price as given • Entry and Exit?
The Market Price in Perfect Competition • Industry Supply and Industry Demand • Individuals and firms have no control • Sum supply and demand for all firms and all consumers to get industry
Market Price in Perfect Competition Price per Industry Supply unit ($) 10 8 P = – $0.254 + $0.000025 Q 6 4 P = $40 – $0.0001 Q 2 Industry Demand 0 50 100 150 200 250 300 350 400 Quantity per time period (millions)
Mathematics • Demand = P = 40 – 0.0001Q • Supply = P = -.254 + 0.000025Q • 40 – 0.0001Q = -.254 + 0.000025Q • Q = 322, 032 • P = 40 – 0.0001*322,032 • $7.80 • Check Graph
Why can’t a firm influence prices in this market structure? Look at impact of them pulling all of their goods off of the market!
Supply shift very small. Equilibrium price increases. However, price increase is so small (e.g., 1/10 penny) that it is not noticed in the market. Pe’ Pe Firm pulls all output off market. S’ $ S D Q
Firm Market Price Taking Firm $ $ S df=MR=AR=Pe D q Q Q1
The Price Output Decision for a Firm under Perfect Competition • Profit Max requires that MR = MC • Under PC price is constant (market price) • MR = P • AR = MR if price is constant (AR = TR/Q = P*Q/Q = P) • Profit Max: P = MR = AR = MC • Firms have horizontal demand curve • Think about GE stock example!
Firm Demand Curve under PC Under PC demand curve is basically flat, price is not a function of output. Firms are price takers. Higher price, no demand Price per unit ($) 10 8 Demand 6 4 2 0 50 100 150 Quantity per time period (000)
Profit Maximizing in Perfect Competition • MR = MC: • MR>MC – produce more, • MR<MC -produce less • Market Price is constant – price taker (horizontal line) • If price is constant then AR=MR=P • So we can say profit is maximized where MR = MC = P = AR • MC curve is the firms supply curve!
Firm Market Profit Maximization for Firm $ $ S MC=sf df=MR=AR=Pe D q Q q1 Q1
The Graph • Firm sells Q* where MR=MC • Average cost of C dollars • Market Price is P • Economic Profits = P (AR) – C (from ATC) dollars per unit • Total economic profit = (P-C)*Q = shaded area on the graph • Above normal rate of return – see that AR>ATC so economic profit • In SR positive economic profits
SR Perfect Competition Cost and revenue per unit ($) MC ATC M P P = AR = MR C N Economic Profit Q * Output per time period
In the Long Run … • Positive Economic Profits (above normal rate of return – shaded area on pervious graph) attract competitors (free firm entry) • Expanding supply pushes prices down • Expanding supply pushes costs of inputs up • Long-Run equilibrium: all economic profits and losses have been eliminated for each firm in the industry • Only receiving “normal rate of return” that is included in economic costs (opportunity cost)
The Long Run Graph • P = MR = AR = ATC – no economic profits or losses • Prices fall from SR and ATC increases from SR • No firms enter or exit • Prices are stable • Each firm is operating at minimum ATC • Shareholders get adequate rate of return based on risk (and that is all).
Long Run PC Cost and revenue per unit ($) MC ATC P = AR = MR P Q * Output per time period
Questions for Class? • Under Perfect Competition: • 1. When would a firm shut down production? • 2. When would a firm exit the market?
Answer to question • Under Perfect Competition: • 1. When would a firm shut down production? • When AVC is not being covered. • The shut down point is where AR=AVC • 2. When would a firm exit the market? • If AVC is not covered it will shut down.
Application: Tax Incidence In Perfect Competition Market Supply P PC = PP Market Demand Q No tax: PC = PP
Application: Tax Incidence In Perfect Competition In the Long Run, • Consumers pay all of the tax (100%) • Producers pay none of tax (0%) • There are no firms making losses
Monopoly • Single Seller • Unique Product • Blocked entry (exit) • May not be perfect information about prices, quality, etc. • Industry demand curve equal to firm demand curve • Downward Sloping demand (industry is firm)
Monopoly Demand Curve Price per unit ($) Monopolist picks point on Demand curve – Which point? 12 10 8 Demand 6 4 2 0 50 100 150 200 Quantity per time period
Monopoly Price and Output • MR = MC for profit maximization • Since demand curve is not horizontal, MR is not equal to price (except first output) • MR < Price = AR = Demand Curve • MR = MC simultaneously determines output and price
Monopoly Price and Quantity • TR = P*Q • Output Effect: increase output increase revenue • Same as Perfect Competition • Price Effect: Monopolist sells one more unit, he must lower price. This will lower revenue. • For a monopolist output is a function of price, not true for perfect competition (no price effect under PC)
Profit Max for Monopoly MR = MC P>ATC economic profits are earned Price and cost per unit ($) P ' P C' C MC ATC Demand = Price MR Q Quantity per time period
Long Run Monopoly Market • Less Output • Higher Prices • Incentive to under produce and drive up price • Social Costs?
Perfect Competition 75,000 haircuts Price = $20 Economic Profits = 0 Monopoly 37,500 haircuts Price = $50 Economic Profits = $1,125,000 Comparison
Monopoly Always Bad? • Natural Monopoly • Microsoft? • Antitrust Laws • Government Regulation
Profit Max for Monopolistic Competition MR = MC P>ATC economic profits are earned Price and cost per unit ($) MC P The profit ATC C MR Demand = Price Q Quantity per time period