Download

1 / 53
530 likes | 893 Vues
Thinking Critically with Psychological Science. Impression of Psychology . With hopes of satisfying curiosity, many people listen to talk-radio counselors and psychics to learn about others and themselves. http://www.photovault.com. http://www.nbc.com. Dr. Crane (radio-shrink).

E N D
Impression of Psychology With hopes of satisfying curiosity, many people listen to talk-radio counselors and psychics to learn about others and themselves. http://www.photovault.com http://www.nbc.com Dr. Crane (radio-shrink) Psychic (Ball gazing)
The Need for Psychological Science Intuition & Common Sense Many people believe that intuition and common sense are enough to bring forth answers regarding human nature. Intuition and common sense may aid queries, but they are not free of error.
Errors of Common Sense Try this ! Fold a piece of paper (0.1 mm thick) 100 times. How thick will it be?
800,000,000,000,000 times the distance between the sun and the earth.
Limits of Intuition Personal interviewers may rely too much on their “gut feelings” when meeting with job applicants. Taxi/ Getty Images
Hindsight Bias Hindsight Bias is the “I-knew-it-all-along” phenomenon. After learning the outcome of an event, many people believe they could have predicted that very outcome. We only knew the dot.com stocks would plummet after they actually did plummet.
Overconfidence Sometimes we think we know more than we actually know. Anagram How long do you think it would take to unscramble these anagrams? WREAT WATER ETYRN ENTRY People said it would take about 10 seconds, yet on average they took about 3 minutes (Goranson, 1978). GRABE BARGE
Psychological Science How can we differentiate between uniformed opinions and examined conclusions? The science of psychology helps make these examined conclusions, which leads to our understanding of how people feel, think, and actas they do!
The Scientific Attitude The scientific attitude is composed of curiosity(passion for exploration), skepticism (doubting and questioning) and humility (ability to accept responsibility when wrong).
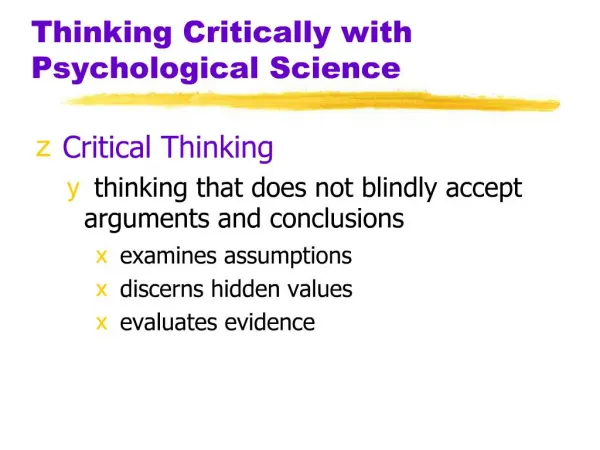
Critical Thinking Critical thinking does not accept arguments and conclusions blindly. It examines assumptions, discerns hidden values, evaluates evidence and assesses conclusions. Courtesy of the James Randi Education Foundation The Amazing Randi
Scientific Method Psychologists, like all scientists, use the scientific method to construct theories that organize, summarize and simplify observations.
Theory ATheoryisan explanation that integrates principles and organizes and predicts behavior or events. explains organizes predicts for example, low self-esteem contributes to depression.
Hypothesis AHypothesis is a testable prediction, often prompted by a theory, to enable us to accept, reject or revise the theory. e.g. People with low self-esteem are apt to feel more depressed.
Research Observations Research would require us to administer tests of self-esteem and depression. Individuals who score low on a self-esteem test and high on a depression test would confirm our hypothesis.
Types of data and design Description Simply describes a phenomenon
Correlation Looks at relations among variables • Correlation versus Causation
Experimentation Exploring Cause and Effect • Independent and Dependent Variables
Description Types: • The Case Study • The Survey • Naturalistic Observation
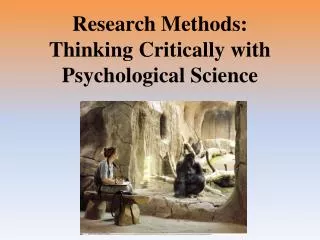
Description Case Study A technique in which one person is studied in depth to reveal underlying behavioral principles. Susan Kuklin/ Photo Researchers Is language uniquely human?
Case Study Clinical Study A clinical study is a form of case study in which the therapist investigates the problems associated with a client. http://behavioralhealth.typepad.com
Survey A technique for ascertaining the self-reported attitudes, opinions or behaviors of people usually done by questioning a representative,random sample of people. http://www.lynnefeatherstone.org
Survey Random Sampling If each member of a population has an equal chance of inclusion into a sample, it is called a random sample (unbiased). If the survey sample is biased, its results are not valid. The fastest way to know about the marble color ratio is to blindly transfer a few into a smaller jar and count them.
Survey Wording Effect Wording can change the results of a survey. Q: Should cigarette ads and pornography be allowed on television? (not allowed vs. forbid)
Survey Response Rate (who agrees to respond?)
Response Biases • Social Desirability • Response Sets
Naturalistic Observation Observing and recording the behavior of animals in the wild and recording self-seating patterns in a multiracial school lunch room constitute naturalistic observation. Courtesy of Gilda Morelli
Descriptive Methods Summary Case studies, surveys, and naturalistic observation describe behaviors.
Indicates direction of relationship (positive or negative) Correlation coefficient Indicates strength of relationship (0.00 to 1.00) Correlation When one trait or behavior accompanies another, we say the two correlate. Correlation Coefficient is a statistical measure of the relationship between two variables. r = + 0.37
Scatterplots Perfect positive correlation (+1.00) Scatterplotis a graph comprised of points that are generated by values of two variables. The slope of the points depicts the direction, while the amount of scatter depicts the strength of the relationship.
Scatterplots Perfect negative correlation (-1.00) No relationship (0.00) The Scatterplot on the left shows a negative correlation, while the one on the right shows no relationship between the two variables.
Do not conceive Conceive Adopt Confirming evidence Disconfirming evidence Do not adopt Disconfirming evidence Confirming evidence Illusory Correlation The perception of a relationship where no relationship actually exists. Parents conceive children after adoption. Michael Newman Jr./ Photo Edit
Order in Random Events Given random data, we look for order and meaningful patterns. Your chances of being dealt either of these hands is precisely the same: 1 in 2,598,960.
Order in Random Events Given large numbers of random outcomes, a few are likely to express order. Jerry Telfer/ San Francisco Chronicle Angelo and Maria Gallina won two California lottery games on the same day.
Experimentation Exploring Cause and Effect Like other sciences, experimentation is the backbone of psychology research. Experiments isolate causes and their effects.
Exploring Cause & Effect Many factors influence our behavior. Experiments (1) manipulate factors that interest us, while other factors are kept under (2) control. ***Effects generated by manipulated factors isolate cause and effect relationships.
Independent Variable An Independent Variable is a factor manipulated by the experimenter. The effect of the independent variable is the focus of the study. For example, when examining the effects of breast feeding upon intelligence, breast feeding is the independent variable.
Dependent Variable ADependent Variable is a factor that may change in response to an independent variable. In psychology, it is usually a behavior or a mental process. For example, in our study on the effect of breast feeding upon intelligence, intelligence is the dependent variable.
Operational definition Precise defining of variable to be manipulated or measured. i.e., What precisely will be manipulated or measured, and how. Examples:
Random Assignment Assigning participants to experimental (Breast-fed) and control (formula-fed) conditions by random assignment minimizes pre-existing differences between the two groups.
Evaluating Therapies Double-blind Procedure In evaluating drug therapies, patients and experimenter’s assistants should remain unaware of which patients had the real treatment and which patients had the placebo treatment.
Experimentation A summary of steps during experimentation.
Comparison Below is a comparison of different research methods.
Describing Data A meaningful description of data is important in research. Misrepresentation may lead to incorrect conclusions.
Measures of Central Tendency Mode:The most frequently occurring score in a distribution. Mean:The arithmetic average of scores in a distribution obtained by adding the scores and then dividing by the number of scores that were added together. Median:The middle score in a rank-ordered distribution.
Measures of Central Tendency A Skewed Distribution
Measures of Variation Range: The difference between the highest and lowest scores in a distribution. Standard Deviation: A computed measure of how much scores vary around the mean.