Download
1 / 36
370 likes | 644 Vues
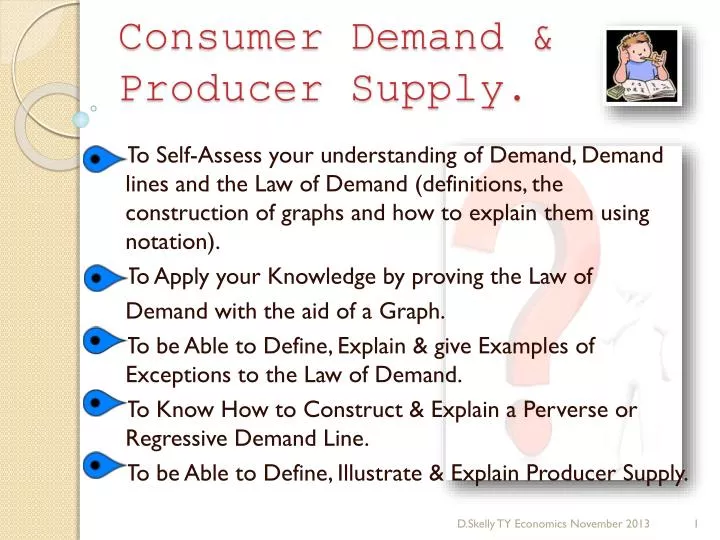
Consumer Demand & Producer Supply. To Self-Assess your understanding of Demand, Demand lines and the Law of Demand (definitions, the construction of graphs and how to explain them using notation). To Apply your Knowledge by proving the Law of Demand with the aid of a Graph.

E N D
Consumer Demand & Producer Supply. To Self-Assess your understanding of Demand, Demand lines and the Law of Demand (definitions, the construction of graphs and how to explain them using notation). To Apply your Knowledge by proving the Law of Demand with the aid of a Graph. To be Able to Define, Explain & give Examples of Exceptions to the Law of Demand. To Know How to Construct & Explain a Perverse or Regressive Demand Line. To be Able to Define, Illustrate & Explain Producer Supply. D.Skelly TY Economics November 2013
What do you Know? KWHL D.Skelly TY Economics November 2013
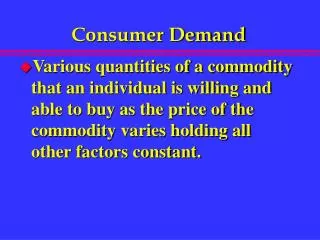
Consumer Demand • A Demand line is a graph illustrating the demand for a good at various prices at any given time. • The Law of Demand states that when price increases the quantity demanded decreases and vice versa. • The Demand line of a Normal Good is Downward-Sloping from Left to Right. D.Skelly TY Economics November 2013
A Demand Curve A negative slope A Bivariate Axis A Normal Good obeys the Law of Demand At higher prices, consumers generally buy less than at lower prices. D.Skelly TY Economics November 2013
A Demand Curve Explained Demand for Good X Notation: P=Price P1=Price in period 1 P2=Price in period 2 Q=Quantity demanded Q1=Quantity demanded in period 1 Q2=Quantity demanded in Period 2 Explanation: At P1, Qd=Q1 When P↑ from P1 to P2, Qd↓ from Q1 to Q2 D.Skelly TY Economics November 2013
With the aid of a graph explain the Law of Demand? D.Skelly TY Economics November 2013
What else do you know? D.Skelly TY Economics November 2013
With the aid of a graph explain a Perverse Demand Line? D.Skelly TY Economics November 2013
Exceptions to the Law of Demand 1.Giffen Goods For some necessities an ↑in P causes an ↑ in Qd. Goods of lower quality make up a large part of expenditure of low-income families. Even if the price of own brand bread (a Giffen good) rises, those on low incomes may continue to buy the good even after the price increase. The shortfall in income as a result of the price increase of the necessity (Giffen good) is made up by cutting back on something else (e.g. a luxury). D.Skelly TY Economics November 2013
Definition: Giffen Goods. Giffen Goods are goods with a positive price effect (relationship between P & Qd) , i.e. when P↑, Qd ↑ and when P↓, Qd ↓ D.Skelly TY Economics November 2013
Exceptions to the Law of Demand 2. Status Symbols / Snob items / Goods of Conspicuous Consumption Some goods are attractive because of their exclusiveness or high price. A P↑ makes them more exclusive and attractive for some consumers. A P↓ makes these goods less exclusive and less desirable to buy. Examples include, designer clothes and sports cars. D.Skelly TY Economics November 2013
Exceptions to the Law of Demand 3.Speculative Goods If potential buyers think that prices are likely to be higher in the future compared to current prices, the current quantity demanded may not fall even if prices increase. For example, a house cost €250,000 in 2012, the current price of that house today is €300,000. It is expected in 2014, that the price will increase to €350,000. Hence, Qd for houses at today’s prices may ↑ even though P has ↑ from €250,000 to €300,000. The reason is because a further price increase is expected,(Property Boom) D.Skelly TY Economics November 2013
Exceptions to the Law of Demand 4.Goods of an addictive nature A person no longer acts Rationallyif they become addicted to goods , e.g. drugs . They buy more of the good in order to get the same Utilityfrom their consumption even when the price of those goods increase. D.Skelly TY Economics November 2013
Producer Supply • A Supply Line is a graph illustrating the number of units of a good made available for sale by the producer / seller at various market prices at any given time. • There is a Positive Relationship between P and Qs, i.e. as P↑, Qs↑ and vice versa (the Law of Supply). • The Supply Line is usually upward sloping from left to right (Remember?: Land is fixed in supply) D.Skelly TY Economics November 2013
A Graph to Illustrate Supply Supply of Good X D.Skelly TY Economics November 2013 50-1.15
Supply Line Explained Explanation D.Skelly TY Economics November 2013
QUESTION No. 1? D.Skelly TY Economics November 2013
ANSWER D.Skelly TY Economics November 2013
Quiz D.Skelly TY Economics November 2013
Summary • We assessed our knowledge of Demand and Demand Lines from the Consumers perspective. • The Law of Demand States that when P↑, Qd↓, and Vice Versa. We demonstrated and explained this with the aid of a Graph. • There are 4 Exceptions to the Law of Demand: Giffen Goods, Snob Goods, Speculative goods, and goods of an addictive nature. We illustrated and explained that these have a Perverse or Regressive Demand Line. This means that they do not comply with the Law of Demand. D.Skelly TY Economics November 2013
Summary • We examined Supply from the Producers perspective. • We learned why there is a Positive Relationship between P & Qs. We know that this means that when P↑, Qs↑ and when P↓Qs↓ . • We learned how to illustrate and explain, with the aid of a Graph (a Supply Line), the Positive Relationship between P and Qs. D.Skelly TY Economics November 2013
Homework • Answer Question 3 on Hand-Out. • Read in advance and underline the main points about Equilibrium in the notes I gave you on Demand and Supply. Preview: Next Class The “Free Market” in 60 Seconds. D.Skelly TY Economics November 2013
Market Equilibrium D.Skelly TY Economics November 2013
Market Equilibrium In a “Free Market”, price will eventually settle at the level where Qd=Qs. This position where there is no tendency for prices to change is called the MARKET EQUILBRIUM. At Equilibrium, the allocation of goods is most efficient because the amount of goods being supplied is exactly the same as the amount of goods being demanded. D.Skelly TY Economics November 2013
The “Free Market” in 60 Seconds. The Invisible Hand? D.Skelly TY Economics November 2013
Market Equilibrium D.Skelly TY Economics November 2013
Market Equilibrium D.Skelly TY Economics November 2013
Market Equilibrium: Numeric D.Skelly TY Economics November 2013
QUESTION? D.Skelly TY Economics November 2013
ANSWER D.Skelly TY Economics November 2013
Excess Demand & Excess Supply EXCESS DEMAND: If Qs > Qd, producers will ↓ price to get rid of surplus stock. EXCESS SUPPLY: If Qd > Qs, producers will ↑ P to remove scarcity. D.Skelly TY Economics November 2013
Graph: Excess Demand & Excess Supply. D.Skelly TY Economics November 2013
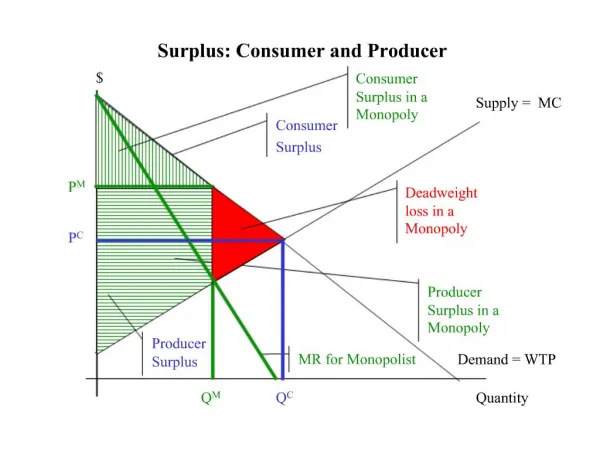
Consumer & Producer Surplus Consumer Surplus Producer Surplus D.Skelly TY Economics November 2013
Consumer Surplus D.Skelly TY Economics November 2013
Producer Surplus D.Skelly TY Economics November 2013
Captions D.Skelly TY Economics November 2013