Download
1 / 1
10 likes | 111 Vues
MMT Adaptive Optics Images of Vesta in L’ and M’ During the 2007 Apparition. A. Heinze , F. Vilas, P. Hinz , and M. Kenworthy.

E N D
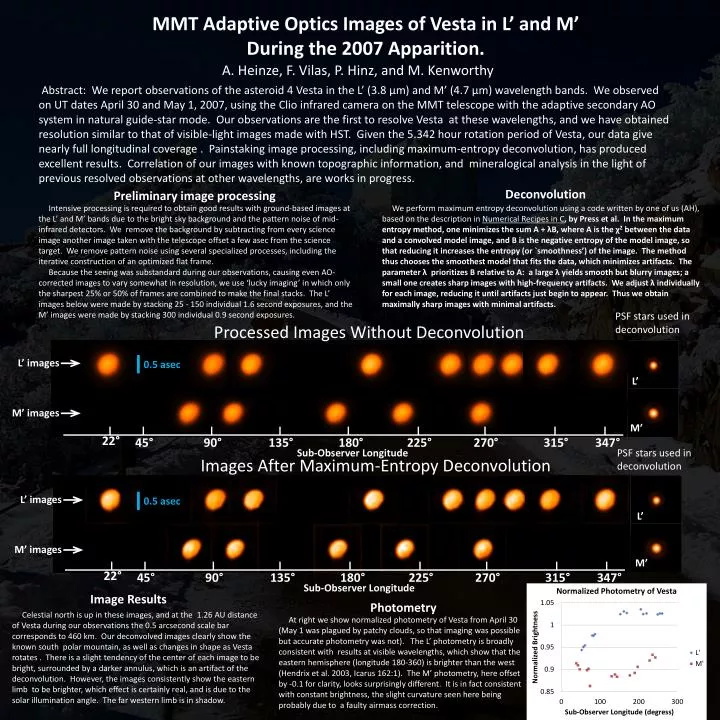
MMT Adaptive Optics Images of Vesta in L’ and M’ During the 2007 Apparition. A. Heinze, F. Vilas, P. Hinz, and M. Kenworthy jAbstract: We report observations of the asteroid 4 Vesta in the L’ (3.8 μm) and M’ (4.7 μm) wavelength bands. We observed on UT dates April 30 and May 1, 2007, using the Clio infrared camera on the MMT telescope with the adaptive secondary AO system in natural guide-star mode. Our observations are the first to resolve Vesta at these wavelengths, and we have obtained resolution similar to that of visible-light images made with HST. Given the 5.342 hour rotation period of Vesta, our data give nearly full longitudinal coverage . Painstaking image processing, including maximum-entropy deconvolution, has produced excellent results. Correlation of our images with known topographic information, and mineralogical analysis in the light of previous resolved observations at other wavelengths, are works in progress. Deconvolution Preliminary image processing Intensive processing is required to obtain good results with ground-based images at the L’ and M’ bands due to the bright sky background and the pattern noise of mid-infrared detectors. We remove the background by subtracting from every science image another image taken with the telescope offset a few asec from the science target. We remove pattern noise using several specialized processes, including the iterative construction of an optimized flat frame. Because the seeing was substandard during our observations, causing even AO-corrected images to vary somewhat in resolution, we use ‘lucky imaging’ in which only the sharpest 25% or 50% of frames are combined to make the final stacks. The L’ images below were made by stacking 25 - 150 individual 1.6 second exposures, and the M’ images were made by stacking 300 individual 0.9 second exposures. We perform maximum entropy deconvolution using a code written by one of us (AH), based on the description in Numerical Recipes in C, by Press et al. In the maximum entropy method, one minimizes the sum A + λB, where A is the χ2 between the data and a convolved model image, and B is the negative entropy of the model image, so that reducing it increases the entropy (or `smoothness’) of the image. The method thus chooses the smoothest model that fits the data, which minimizes artifacts. The parameter λprioritizes B relative to A: a large λ yields smooth but blurry images; a small one creates sharp images with high-frequency artifacts. We adjust λ individually for each image, reducing it until artifacts just begin to appear. Thus we obtain maximally sharp images with minimal artifacts. PSF stars used in deconvolution Processed Images Without Deconvolution L’ images 0.5asec L’ M’ images M’ 22° 45° 90° 135° 180° 225° 270° 315° 347° Sub-Observer Longitude PSF stars used in deconvolution Images After Maximum-Entropy Deconvolution L’ images 0.5asec L’ M’ images M’ 22° 45° 90° 135° 180° 225° 270° 315° 347° Sub-Observer Longitude Image Results Photometry Celestial north is up in these images, and at the 1.26 AU distance of Vesta during our observations the 0.5 arcsecond scale bar corresponds to 460 km. Our deconvolved images clearly show the known south polar mountain, as well as changes in shape as Vesta rotates . There is a slight tendency of the center of each image to be bright, surrounded by a darker annulus, which is an artifact of the deconvolution. However, the images consistently show the eastern limb to be brighter, which effect is certainly real, and is due to the solar illumination angle. The far western limb is in shadow. At right we show normalized photometry of Vesta from April 30 (May 1 was plagued by patchy clouds, so that imaging was possible but accurate photometry was not). The L’ photometry is broadly consistent with results at visible wavelengths, which show that the eastern hemisphere (longitude 180-360) is brighter than the west (Hendrix et al. 2003, Icarus 162:1). The M’ photometry, here offset by -0.1 for clarity, looks surprisingly different. It is in fact consistent with constant brightness, the slight curvature seen here being probably due to a faulty airmass correction.