Download
1 / 23
230 likes | 377 Vues
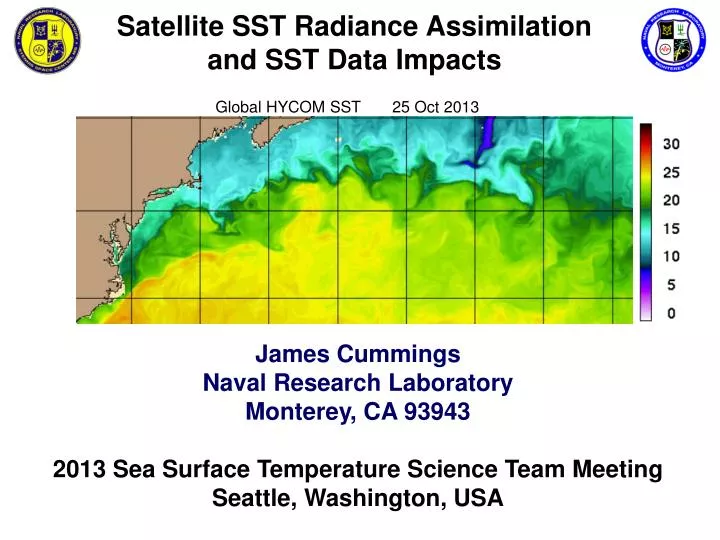
Satellite SST Radiance Assimilation and SST Data Impacts. Global HYCOM SST 25 Oct 2013 00Z. James Cummings Naval Research Laboratory Monterey, CA 93943 2013 Sea Surface Temperature Science Team Meeting

E N D
Satellite SST Radiance Assimilation and SST Data Impacts Global HYCOM SST 25 Oct 2013 00Z James Cummings Naval Research Laboratory Monterey, CA 93943 2013 Sea Surface Temperature Science Team Meeting Seattle, Washington, USA
SST Radiance Assimilation: Objectives • incorporate impact of real atmosphere above SST field • remove atmospheric signals in SST radiance data • include variables known to affect satellite SST radiances: • atmospheric temperature • atmospheric water vapor • SST • aerosols (dust, smoke) - not used yet • all variables are available from NWP, aerosol, and ocean model forecasting systems GOES-15 Water Vapor HYCOM SST Forecast
SST Radiance Assimilation: Observation Operator SST Radiances (BTs) NWP Fields Ocean Model SST CRTM Forward Model: TOA-BTs Calibration, QC, Cloud Clearing Compute Differences: δBTs SST Radiance Monitoring CRTM Jacobians (Tb/x) SST Inverse Model: δSST Other Observations: T,S,U,V Observation & First Guess Errors 3DVAR Minimization
SST Radiance Assimilation: Observing Systems GOES METOP GAC METOP LAC NOAA GAC NOAA LAC NPP VIIRS • NAVOCEANO SST Radiance Data: • GOES-13, GOES-15 • METOP-A, METOP-B (GAC and LAC) • NOAA-18, NOAA-19 (GAC and LAC) • NPP VIIRS • COMS-1 • No radiance data available for MSG and MTSAT
CRTM Forward Model: Obs vs. Simulated BTs METOP-A NOAA-19 NPP VIIRS Ch3 NAVO Buoy Matchup Data 25 Aug to 8 Sep 2013 NWP Priors: 90 min, 16 km Ch4 Ch5
CRTM Forward Model: Bias Correction METOP-A NOAA-19 Liquid Water Path kg/m2 Liquid Water Path kg/m2 • by definition satellite SST radiances are cloud free • but NWP priors may have clouds • TCWV bias correction modeled as quadratic function (red curves) • calculated for all satellites and all channels using 15-day sliding time window of NAVO SST radiances and buoy matchups
SST Inverse Model • Computes SST correction (Tsst ) given TOA BT innovations (BT) and CRTM Jacobians (J): • Requires specification of prior error statistics: • air temperature: εt • specific humidity: εq • sea surface temperature: εsst • satellite BTs + radiometric error: εbt • Partitions BT innovations into Tsst , Ta , Qa corrections
SST Inverse Model: NWP Prior Errors NAVGEM Ensemble: Specific Humidity Provides situation dependent uncertainty of atmospheric forecasts Specific humidity variability greatest at low latitudes
SST Inverse Model: NWP Prior Errors NAVGEM Ensemble: Air Temperature Air temperature variability greatest at high latitudes
SST Inverse Model: Ocean SST Errors HYCOM 3DVAR SST Background Error Atlantic Indian Pacific 5 Sep 2013 Computed from time history of model forecast differences at update cycle interval (24-hr) SST variability greatest in tropics, Antarctic circumpolar, and western boundary currents
SST Inverse Model: NAVO SST Corrections Tsst METOP-A 5 Sep 2013 Day Night • large positive SST corrections at high latitude dry atmospheres • shows globally defined NAVO SST retrievals biased in some regimes • some day/night differences in SST corrections (e.g., U.S. west coast)
SST Inverse Model: Air Temperature Corrections Ta METOP-A 5 Sep 2013 Day Night • air temp corrections generally small given expected range of atmospheric temperatures • corrections tend to be largest at high latitudes where NWP model air temperature variability is high (some exceptions, e.g. WestPAC)
SST Inverse Model: Water Vapor Corrections Qa METOP-A 5 Sep 2013 Day Night • water vapor corrections tend to be greater at low latitudes where NWP model water vapor variability is high
SST Inverse Model: Correction Data Density METOP-A METOP-B Tsst NOAA-18 NOAA-19 NAVO SST Correction vs. Total Column Water Vapor: 5 Sep 2013
Analysis – Forecast System Observation (y) Analysis (xa) Forecast (xf) NCODA 3DVAR HYCOM Background (xb) Data Impact System Observation Sensitivity (J/y) Initial Condition Sensitivity (J/xa) Adjoint of HYCOM Forecast Error J: (J/xf) Adjoint of 3DVAR What is the impact of observations on measures of forecast error (J) ? Observation Impact Equation (Langland and Baker, 2004)
Observation Impact Equation: Interpretation For any observation assimilated, if ... < 0.0 the observation is BENEFICIAL - forecast errors decrease > 0.0 the observation is NON-BENEFICIAL - forecast errors increase • Non-beneficialimpacts: • not expected, assimilation should decrease forecast error • if it is persistent, may indicate observing system problems
SST Data Impact: Satellite Observing Systems Global HYCOM - November 2012 Per Ob Data Impacts for Reducing HYCOM 48-hr SST Forecast Error Atlantic Pacific Data assimilated are NAVOCEANO SST retrievals
SST Data Impact: Non-beneficial Impacts METOP-A - November 2012 (averaged at model grid locations) Atlantic Pacific
SST Data Impact: Non-beneficial Impacts NOAA-19 - November 2012 (averaged at model grid locations) Atlantic Pacific
SST Data Impact: Non-beneficial Impacts METOP-A vs. NOAA-19 - November 2012 (averaged at model grid locations) METOP-A NOAA-19 More non-beneficial impacts from assimilation of NOAA-19 retrievals than METOP-A Differences in quality of AVHRR instruments on the two satellites?
SST Data Impact: Non-beneficial Impacts GOES - November 2012 (averaged at model grid locations) Atlantic Pacific
Assimilation and Data Impact: Conclusions • CRTM forward and SST inverse modeling: • removes atmospheric signals from radiance observations • real atmosphere needed to understand changes in TOA BTs • Data Impacts: • assimilation of satellite SST data reduces HYCOM forecast error • non-beneficial impacts show geographic, instrument, and satellite zenith angle dependencies • Science Team Objectives: • data classification: TOA-BT Tsst , Ta , Qa partitions and data impacts provide pixel level information • data merging and gridding: global, model-based 3DVAR with full error analysis and data impact components • communication: contribution to MICROS? Other inter-comparison activities along the lines of the ESA CCI?