Download

1 / 100
1k likes | 1.03k Vues
Designing a Web Page with Tables. Maureen Smith Professor, Saddleback College Tutorial 4. Lesson Plan. Review Tutorial 4 - Designing a Web Page with Tables Session 4.1 Session 4.2 Session 4.3 Review. Objectives!. Objectives. Work with preformatted text to create a basic text table

E N D
Designing a Web Page with Tables Maureen Smith Professor, Saddleback College Tutorial 4
Lesson Plan • Review • Tutorial 4 - Designing a Web Page with Tables • Session 4.1 • Session 4.2 • Session 4.3 • Review
Objectives! Objectives • Work with preformatted text to create a basic text table • Create the basic structure of a graphical table • Organize table rows into row groups • Add a caption to a table • Describe how to add summary info
Create table borders and gridlines • Specify the width and height for different table elements • Format contents of table cells • Apply background image and color • Align a table and cell contents
Describe the different types of page layouts that you can achieve with tables • Work with both fixed-width and fluid layouts • Create a newspaper-style layout using tables
Session 4.1 • You will design a Web site for a weekly edition of a newspaper • Should have same look and feel as the printed one—classic, traditional • In order to implement this design, you will learn how to create and format tables
Tables on the World Wide Web • Your first assignment is to place a marathon story • With it, a table that lists the top three male and female finishers • See Figure 4-1 • There are two ways to insert a table of information on a Web page
You can create a text table or a graphical table • A text table contains only text, evenly spaced out in rows and columns • Text tables use only standard typewriter characters so that even a line in a text table is created by repeating a typographical character, such as a hyphen, underline or equal sign • See Figure 4-2
A graphical table appears as a graphical element • Allows you to include design elements such as color, shading, and borders • You have greater control over the appearance • Can control the size of individual table cells and text alignment • Can even create cells that span several rows or columns
Graphical tables are more flexible and attractive than text tables • But there are some situations when you need to use a text table • Text-only browsers can display only text • Working with the tags for graphical tables can be complicated and time-consuming
Creating a text table • The beginning of the file you’ll use has already been created • The page consists of an article about the marathon • You’ll add the race results table between the first and second paragraphs • See tutorial3/race1.htm
Using fixed-width fonts • To create a text table, you have to control the type of font that is used • Relies on spaces and the characters that fill those spaces to create its column boundaries • Have to use a font that allots the same amount of space to each character and to the empty spaces between characters • This type of font is called a fixed-width font, or a monospace font
OR Courier Times New Roman • Most typeset documents (your book) use proportional fonts • The width of each character varies according to the character’s shape • Character “m” is wider than “l” • Proportional fonts are more visually attractive so you might be tempted to use them
But if you do, the varying width of the characters and spaces between characters might cause errors when the page is rendered • See Figure 4-5 to see how a proportional font loses alignment when the font size is increased or decreased • See Figure 4-6, with fixed-width fonts, to see that the columns remain aligned regardless of font size
Different browsers and operating systems may use different font sizes to display text, so should always use a fixed-width font to ensure that the columns remain aligned
Using preformatted text • Recall that HTML ignores extra blank spaces, lines, or tabs • However, to control the appearance of a table, will need to use spaces and other characters • Can insert the <pre> tag to display preformatted text--text formatted in ways that you want retained • Any text formatted with this tag retains those extra blank spaces and lines
It also displays text using a fixed-width font, which is what you want for the text table • When you use this tag, you insert blank spaces by pressing the spacebar to align the columns of text in the table • See tutorial4/race2.htm • By using the <pre> tag, you’ve created a text table that every browser can display
You’ve also ensured that the columns will retain their alignment no matter what font the browser is using • Now create the graphical table
Defining a table structure • Complicated because you have to enter a lot of information to define the layout and appearance • First step is to specify the table structure • Number of rows and columns • Location of column headings • Placement of a table caption • Then can start entering text and data into the cells of the table
The beginning of the page for the graphical table has already been created • See tutorial4/race3.htm
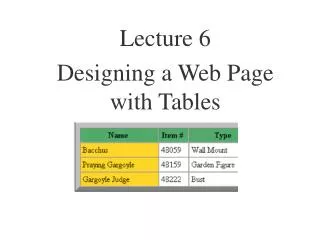
Marking a table, table row, and table cell • To create a graphical table, start with the two-sided <table> tag • Identifies where table structure begins • Indicates where the table ends • Then you identify the number of rows by inserting a two-sided <tr> tag at the beginning of each table row, starting with the top row and moving down
The end of each table row is indicated by a </tr> tag • Finally, within the <tr> tags you must indicate the location of each table cell with a two-sided<td> tag (table data) • HTML does not provide a means of specifying the number and placement of table columns
Columns are determined by how many cells are inserted in each row • If you have four <TD> tags in each table row, you have four columns <table> <tr> <td> First Cell </td> <td> Second Cell </td> </tr> </table>
This example has two columns • You are going to create seven rows and four columns • First row will contain column headings • Remaining six will display the table’s data • See tutorial4/race4.htm • Add the text for each cell • See tutorial4/race5.htm
Creating table headings • XHTML provides a special tag for cells that will act as table headings (column headings) • The two-sided<th> tag is used for cells within the table just like the <td> tag • Difference is that that text formatted with the <th> tag is centered within the cell and displayed in bold • Table can have several rows of table headings
In fact, because the <th> tag is a replacement for the <td> tag, can use it for any cell containing text you want displayed in centered bold type • You have a single row of table headings • See tutorial4/race6.htm
Creating row groups • Can classify a table’s rows into row groups that indicate their purpose in the table • Three types: table header, table body, table footer • Because order is important, table header must be listed before footer, and both must appear before the body • To mark header rows:
<thead> table rows </thead> • Can contain only one set of header rows • To mark header footer: <tfoot> table rows </tfoot>
Only one footer per table • To mark rows of table body: <tbody> table rows </tbody> • Can have multiple body sections • Row groups are used for tables that draw data from external sources
Databases, XML docs • Programs can be written in which contents of a table body span across several pages, with contents of header/footer repeated on each page • Not all browsers support this • Creating groups does not affect appearance • But can apply styles to groups to make them appear differently
Let’s mark the table’s header and body • No footer • See tutorial4/race7.htm
Creating a table caption • Captions are used to provide descriptive info about the table • Use the <caption> tag <caption>content</caption> • Where content indicates is the content of the caption • MUST appear directly after opening <table> tag
By default, is centered above the table • Can change that using align attribute <caption align=“position”>content</caption> • where position is bottom or top, centered • Left or right, aligned with margin • Older browsers recognize only top and bottom
Let’s add “Race Results” to the table in bold • See tutorial4/race8.htm
Adding a table summary • For non-visual browsers, useful to include a summary of a table’s contents <table summary=“description”> … </table> • where description is a description of the table’s purpose and contents • Does not affect appearance in visual browsers • Now we format the table!
Session 4.2 • Working with the table border • Lack of gridlines and borders makes the table difficult to read • Let’s add borders, gridlines, and background color • And control placement, size, and table border
Adding a table border • By default, browsers display tables without borders • Can add one with the BORDER property <table border=“value”> • where value is the width of the border in pixels • See Figure 4-18 for different sizes • Note that the size of the internal gridlines is not affected by the border attribute
Let’s add a 5-pixel border • See tutorial4/race9.htm • By default, table borders are displayed in two shades of gray for a three-dimensional look • Can change that with: <table bordercolor=“color”>
where color is an HTML color name or hexadecimal value • This attribute has been deprecated, but is still widely supported (not by Opera) • See Figure 4-21 • To work around discrepancy between IE and Netscape, can use bordercolorlight and bordercolordark • See Figure 4-22
Let’s change the color of the table border • See tutorial4/race10.htm • Depending on browser, your colors may not match what is shown
Creating frames and rules • By default a table border surrounds entire table and each of the cells • To change this, use frame and rules attributes • Frame attribute determines which sides will have borders <table frame=“type”> • where type is box (default), above, border, below, hsides, vsides, lhs, rhs, void
See Figure 4-25 for frames values • See Figure 4-26 for effects of these values on a table grid • Rules attribute controls how gridlines are drawn • <table rules=“type”> • where type is all (default), cols, groups, or none • See Figure 4-27 for rules values
See Figure 4-28 for effect of these values • Both attributes might not be supported in older browsers • We will not make any changes to frame or rules values
Sizing a table • Table still looks crowded • Maybe smaller internal borders, more space between text and borders, slightly wider • Tables are sized automatically by browser, but there are several attributes that can override size choices made by the browser Thank goodness!
Setting cell spacing • Cell spacing controls amount of space between table cells • Default is 2 pixels; to change: <table cellspacing=“value”> • where value is size in pixels • See Figure 4-29 for different cell spacing • Changing this value also impacts size of interior borders
Let’s change the gridlines to be as small as possible by decreasing the cell spacing to 0 pixels • Because interior border includes a drop shadow, even setting cell spacing to 0 will not remove the gridlines • See tutorial4/race11.htm
Setting cell padding • Distance between cell text and cell border is known as cell padding • Default is 1 pixel, which may be too little <table cellpadding=“value”> • where value is size in pixels • See Figure 4-32 for different cell padding • Let’s increase cell padding to 4 pixels • See tutorial4/race12.htm
Setting the table width • Table would look better larger • Overall size is determined by its content <table width=“value”> • where value is width in pixels or percentage of width of the containing element • 100% of page element has table fill entire page • With an absolute size, table remains constant, regardless of user’s monitor size
Percentage allows table to match each monitor’s dimensions • If table requires a certain width to display contents, will ignore a width value smaller • Many browsers, but not XHTML, support <table height=“value”> • where value is height in pixels or percentage of height of element