Download
1 / 81
810 likes | 814 Vues
EDD Performance against 2015/16 Annual Performance Plan (APP) for the 1 st Quarter 2015/16. Presentation to the Portfolio Committee Economic Development 1 September 2015. Background.

E N D
EDD Performance against 2015/16 Annual Performance Plan (APP) for the1st Quarter 2015/16 Presentation to the Portfolio CommitteeEconomic Development 1 September 2015
Background On the 24th March 2015 the Ministry presented the conceptual framework of the Strategic Plan and Annual Performance Plan for 2015/16 to the Economic Development Portfolio Committee, providing the context in which we operate and an overview of the Department’s programmes and strategic objectives. On the 14th April 2015 the Ministry presented the details of the Department’s KPIs and products or outputs including: • 3 programmes to organise the Department around • 6 strategic objectives to provide direction • 23 KPIs to give effect to the strategic objectives • 164 products / outputs from the KPIs. Today we will report on work performed in Q1 according to the Department’s Strategic Plan and Annual Performance Plan.
Programmes and Strategic Objectives Products are ongoing 2 Products 2 KPIs SO 1: 2 KPIs (2 Products) Programme 1: Administration • Strategic objective 1: Provide strategic guidance to the Department; and technical and administrative support to the Ministry and the Department to achieve strategic objectives 2, 3, 4, 5 and 6 22 Products 6 KPIs SO 2: 5 KPIs (19 Products) SO 3: 1 KPI (3 Products) Programme 2: Growth and Jobs Drivers • Strategic objective 2: Coordinate jobs drivers and implementation of the NGP economic strategy in support of the NDP • Strategic objective 3: Facilitate social dialogue and implementation of social accords 140 Products 15 KPIs SO 4:6 KPIs (108 Products) SO 5: 5 KPIs (23 Products) SO 6: 4 KPIs (9 Products) • Strategic objective 4:Coordinate infrastructure development & strengthen its positive impact on the economy and citizens • Strategic objective 5: Promote investment, industrial funding and entrepreneurship for jobs and inclusive growth • Strategic objective 6: Promote competition, trade and economic regulation in support of job creation, industrialisation & social inclusion Programme 3: Investment, Competition & Trade
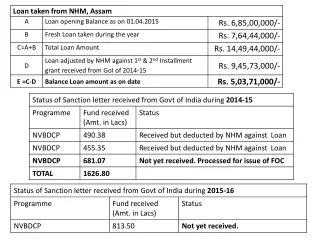
KPI 1 KPI 1 Work completed towards an unqualified audit: Respond to AG queries EDD completed the following work in relation to the preparation for the 2014/15 final audit by the Auditor-General (AG): • physical verification of movable assets; • year-end reconciliations, closed the financial systems and prepared the annual financial statements; • Compiled evidence files in support of the performance information; • convened an Audit Committee meeting to consider the annual financial statements and performance information for submission to the AG; • engaged with the Auditor-General at Ministerial level to receive feedback and to advise on measures to ensure sound management in the department; • convened meetings to monitor progress on the implementation of corrective measures to address the Auditor-General’s queries and findings; • the Acting DG engaged with ITAC implementing corrective measures to address the audit findings of the previous financial year.
KPI 2 KPI 2 Work completed: Pilot survey completed • EDD conducted a pilot survey to identify the quality and effectiveness of support services in the department and to implement interventions to improve service delivery. The survey covered Finance, HR, SCM, Communications, IT and Facilities Management. • As a result of the pilot survey, the DG began to implement the following: • Measures to ensure speedy responses; • Training and communication of policies and procedures has been developed; • Review of systems to remove unnecessary bureaucratic delays. • This process will continue throughout the year to ensure the results are embedded. • In the 2nd quarter, these interventions will be assessed by focus groups. • In the 3rd quarter the Survey will be redesigned or amended where necessary, incorporating the learnings from the previous quarter. • In the 4th quarter the Survey will be repeated, results analysed and tabled with the Minister. A baseline will be developed for targets for the following financial year.
KPI 3 KPI 3 Work completed: Report on employment The Department conducted a detailed analysis of employment trends since the adoption of the NGP in October 2010, assessing progress for each of the Jobs Drivers identified in the strategy. The findings assist in directing the work of the state to prioritise the 9-point plan announced during the 2015 State of the Nation Address.
Jobs context • From 1994 to 2008, the economy grew at a faster rate than the preceding 15 years. • The 2008/09 global economic crisis which started in the US, rapidly spread through the transmission belts of weaker global demand, contraction of credit to the real economy and business confidence, affecting particularly countries with high trade to GDP ratios, like SA • The impact on jobs was sudden and significant: about one million jobs were lost • The response of government to this was two-fold: • Short-term interventions based on a social accord signed in 2009, covering funds for companies and workers in distress; and • Development of a new growth path addresses structural constrains and to deepen the jobs impact of economic growth
CASE STUDY – JOBS GROWTH • Cabinet adopted the NGP’s focus on jobs drivers in October 2010. • This is the economic strategy to give effect to the vision of the National Development Plan to create 11 million new jobs by 2030. • The NGP prioritised job creation through the alignment of policies across the state to support key jobs drivers • The analysis draws primarily on the Quarterly Labour Force Survey for overall jobs data • The data shows robust jobs growth over the period • This perception of limited jobs growth may arise from • The fact that joblessness is still high • Concerns about the economic slowdown given the end of the commodity boom, energy shortages and a conflictual labour relations environment • We need to develop a more evidence-based discussion
Key trends from October 2010 to June 2015 The share of working age adults with employment increased from 41,3% to 43,5% Employment climbed by two million, or 15% 10,8 million South Africans have formal jobs outside of agriculture – 1,4 million more than in October 2010 Total employment rose from 13,6 million to 15,7 million Women gained a million jobs, increasing their share in total employment from 43% to 44% - largely because of growth in health and education All sectors gained jobs except manufacturing, with construction and the public services growing particularly fast Employment growth has been faster than GDP growth in past 2 years Youth employment rose by 600 000 or 10,6% (to March ‘15) for youth aged 18-34 with young women taking 311 000 or 52% of these jobs
CASE STUDY – JOBS GROWTH • Employment has risen steadily from October 2010, for a gain of two million new jobs • But we have to do more • New headwinds – sharp fall in mineral prices, electricity shortfalls, workplace conflict • Unemployment has fallen but remains very high by global standards
Jobs growth by sector • Jobs growth has varied by sector • The counter-cyclical role of government appeared in relatively rapid growth in public sector jobs (under “community and social services” in the chart) • Build programme boosted construction jobs • Mining and agriculture reversed long-term decline in this period • Business services also grew – particularly security and cleaning Utilities and logistics includes transport, electricity, gas, water and telecommunications. Most of the employment in this sector is in transport.
Where the new jobs are • The public sector accounted for a third of all new jobs • Business services and construction together contributed another third
Jobs and growth • Employment fell more than GDP in the recession • In the 2014 and 2015 financial years, employment grew more rapidly than the economy • This points to growing labour intensity • The challenge will be to sustain this trend going forward as well as to maintain economic growth in the face of global headwinds a. GDP growth based on GDP for year to March as the sum of four quarters ending in March in real terms
Infrastructure and jobs • Infrastructure is a priority jobs driver under the NGP • This commitment led to sustained growth in infrastructure spending over the past five years, with substantial direct and indirect employment impacts • Infrastructure supports employment creation in four ways: • In construction of new infrastructure • In operations and maintenance • In industries that supply inputs to infrastructure projects • By increasing the overall productivity and efficiency of enterprises, stimulating new investment and improving competitiveness • Success in the build programme can be seen in the growth of construction employment since 2010
Construction jobs • Construction covers housing and other infrastructure. • From the Global Financial Crisis in 2008/9, most construction growth occurred in non-housing infrastructure. • In terms of jobs, it was one of the fastest growing sectors • From October 2010 to June 2015, construction jobs rose by 283 000 or 25%, compared to 15% growth in jobs in the rest of the economy. • In June 2015, construction accounted for 9% of total employment, up from 8% in 2010, but contributed 14% of all new jobs from October 2010 • The broad spatial impact of the build programme emerges from the rapid growth in employment in Limpopo and Mpumalanga as a result of the complex of power plants, coal mines and the related roads and water infrastructure. • From October 2010 to June 2015, total employment in Limpopo climbed by 357 000, or 38%, while Mpumalanga gained 209 000 new jobs, or 22%. • The share of adults with employment rose from 29% to 36% in Limpopo in this period, and from 39% to 43% in Mpumalanga.
Job creation by province • All the provinces grew employment since the adoption of the NGP to the end of June 2015 • Gauteng accounted for the largest share of new employment, at almost a third of the total, with 650 000 new jobs in Gauteng from October 2010 to June 2015. • Limpopo and Mpumalanga saw the most rapid growth rate – that is, the largest growth in employment relative to their level of employment
Job creation by province All the provinces grew employment since the adoption of the NGP to the end of June 2015 Gauteng accounted for the largest share of new employment, at almost a third of the total, with 650 000 new jobs in Gauteng from October 2010 to June 2015. Limpopo and Mpumalanga saw the most rapid growth rate – that is, the largest growth in employment relative to their level of employment
Some conclusions Index of mineral prices • Considerable progress was made in job creation from 2010, when the New Growth Path was adopted • Jobs grew in a number of productive sectors of the economy, including agriculture and mining. While output in manufacturing recovered, this has not translated into jobs growth, reflecting rising productivity in the sector • The end of the commodity boom, with an average fall of over 50% in South Africa’s export prices from 2011, will make progress on jobs more difficult with new pressures on mining jobs combined with the negative multiplier of the mining industry on the rest of the economy • This requires additional actions
Nine-Point Plan The Nine-point Plan announced in SONA in February 2015 is a response to the new global conditions. They cover: • Agriculture and agro-processing • Manufacturing through higher impact Industrial Policy Action Plan • Advancing beneficiation through more local processing • Unlocking the potential of SMMEs, cooperatives, township and rural enterprises • Growing the oceans economy • Resolving the energy challenge • Reducing workplace conflict • Scaling-up private sector investment • Supporting infrastructure investment and innovation
KPI 3 KPI 3 Work in progress but not completed: Amendments to the Competition Act In the first quarter EDD commenced work on the amendments to the Competition Act. This includes • Additional consultation with key internal stakeholders on the legislative amendments; • Addressing legal complexities related to options for Cabinet’s consideration; • Doing additional research where required. During the same period EDD did extensive work on the Criminal Matters Amendment Bill in partnership with the Department of Justice and the PICC. This is reported on in KPI 11.
KPI 4 KPI 4 Work completed: Contributions in IMCs, ESEID and War Room. During the quarter, significant work was done to support the integration of policy and jobs drivers through the work of the economic cluster and the inter-ministerial committees set up by Cabinet. These included: • Technical and policy contributions for Economic Sectors, Employment and Investment Development (ESEID); • Policy and implementation feedback for the IMC on Energy.
KPI 4 Steel Industry interventions (incl Q2) • The end of the commodity super-cycle resulted in a glut of steel on global markets. The South African steel industry was seriously affected. • During the quarter, EDD undertook a range of efforts to address the circumstances of the industry. These included: • Meeting steel-makers to identify the extent of the economic challenges; • Liaising with regulators to expedite processes to evaluate the industry requests; • Appointing a panel of experts from the steel industry to provide advice and options to the Minister; • Engaging development finance institutions on short-term financing options; • Completing a competition probe into pricing by the dominant steel-mill • Liaising with other Ministers to enable a coordinated government response.
KPI 4 Update on soya plant in Mpumalanga • The Noble Soya plant became operational in December 2013, creating the continent’s largest and most advanced soya crushing plant • Between December 2013 to July 2015 the plant turnover was R1.2 billion • The plant employs 128 people, with an estimated 2 600 jobs sustained by commercial farmers. • With the company’s operations now stable, we are pursuing efforts to bring black small-holder farmers into its supply-chain • With the recent drought and poor prognosis for summer rainfall, Noble is looking at expanding its dry land cultivation in the Free State and North West provinces to spread its risk.
KPI 4 Research findings: Examples • One out of every five Ford Ranger bakkies made in Roslyn Pretoria, is sold elsewhere on the continent. • The largest export market for manufactured plastic is Zimbabwe and for televisions is Zambia. • 244 000 direct jobs in South Africa are sustained by exports to the rest of the continent KPI 4 Work completed: African regional integration One of the jobs drivers in the NGP is African regional integration. Work on this was originally scheduled in the Strategic Plan for 2016/17. Following a number of attacks on foreign migrants during the quarter, a Cabinet-wide response included that EDD focus on research and advocacy on the importance of trade and investment across the continent, to provide context to the debate on migrants. The Minister put together a program including: • Research • Holding a stakeholder Symposium • Engaging workers and communities.
KPI 4 Case study: Africa Day Symposium – EDD with IDC and University of Johannesburg • Ministry hosted an Africa Day Symposium on African Integration and how South Africans benefit from our economic links with the rest of Africa. • Over 100 participants • Business and labour leaders from SA and the rest of the continent • Community members including youth, parliamentarians, academics and students attended. • Addressed African integration as a critical driver for shared economic prosperity and job creation. • Shared practical experiences, research, concerns and aspirations. OUTCOME: A SHARED COMMITMENT TO TELL THE AFRICAN STORY MORE CONSISTENTLY IN SOUTH AFRICA.
African economic development – Advocacy and community engagement
KPI 5 KPI 5 Work completed: Support for Green Economy Accord The Green Economy Accord requires steps to be taken to reduce energy consumption by industry. • During the quarter, the Ministry engaged with stakeholders in the fashion manufacturing industry, culminating in a Fashion Industry Imbizo on energy and the green economy, held on 9 June 2015. • The Imbizo covered case studies of new technologies that reduce companies’ energy consumption and costs. • Eskom discussed its load-shedding schedules and what can be done to reduce the negative impact on industry. • The IDC highlighted the impact of funding energy-efficient technologies in the local industry. • A sock manufacturer provided feedback to industry representatives of the steps to be taken to retool for an energy-constrained environment whilst maintaining jobs, turnover and profitability.
Green economy: case study A sock manufacturer GLENCAROL provided feedback to industry representatives on the steps they have taken to retool for an energy-constrained environment whilst maintaining jobs, turnover and profitability. • Power consumption reduced 950 000 kwhr to 650 000 kwhr, with annual savings of R2,5 million and 432 tons less coal used per annum • Business grew by 53% since 2007 when the company employed 497 people to current employment of 694 people • The company made a number of interventions: • Productivity support from the Production Incentive • Eskom funding to replace 1800 bulbs and fittings and space utilisation • New industrial air-conditioning and heat extraction services
KPI 7 KPI 7 Work completed: MinMec EDD convened a that culminated in a MinMec attended by Ministers and MECs, which covered: • Spatial development and the Special Economic Zones; • Promotion of the black industrialists programme; • Small business development initiatives; • A new framework for provincial economic development planning; • Use of innovative building technologies in the National Infrastructure Plan; • The extension of the Africa Growth and Opportunities Act (AGOA) by the United States. WORK COMPLETED: PROVINCIAL PLANS EDD worked with Limpopo, Mpumalanga and Free State and assessed their economic development plans. This work included: • Ensuring alignment of the provincial plans to national economic development goals and plans; • Identification of provincial priorities including key value chains and sectors.
Case study: Limpopo Following engagement with the province, Limpopo will focus on: • Productive sectors such as manufacturing, mining and agriculture; • Eliminating unnecessary regulatory burdens; • Up-skilling the labour force; • Expanding employment in agriculture (horticulture, meat production and forestry value-chains focusing on beneficiation); • Reducing workplace conflict; • Small business development. Potential projects include: • Support for economic revitalisation in mining regions (Waterberg and Sekhukhune) with a focus on unblocking obstacles to development; • Promotion of the use of Innovative Building Technologies in Lephalale. Case study: Mpumalanga Analysis of the province demonstrates the following: • Province has targeted jobs drivers and sectors identified to create jobs - agriculture and forestry, manufacturing, tourism and other high level services (e.g. ICT), mining and energy, green economy and infrastructure; • Strategic interventions include BBBEE, strategic procurement, skills development, reducing the cost of doing business, support to SMMEs and co-ops, and DFI funding; • Strengthened oversight and monitoring mechanisms will assist in improving implementation. Potential projects include: • Linking provincial youth SMMEs to the retrofitting programme: establishment of energy bulb manufacturing plant (Mpumalanga). • Support mining initiatives in Emalahleni Municipality through the Revitalization of Distressed Mining Towns Programme (Mpumalanga). Case study: Free State Analysis of the province demonstrates the following: • Plans to diversify the economy from reliance on mining and agriculture into manufacturing, tourism and infrastructure (transport); • Continued focus on beneficiation in mining and agriculture (i.e. agro processing); • The need for more skills development in fields such as artisans and engineering. Potential projects include: • Unblocking agro-processing projects; • Supporting the textile industry’s expansion plans through coordination and support measures; • Assisting the province in its development of its Provincial Economic Strategy.
KPI 8 KPI 8 Work completed: More effective industrial relations EDD provided support at technical level and to the Minister during the social dialogue with business, labour and community representatives on a national minimum wage and on reducing industrial conflict. The dialogue process included an extensive exchange of information on international experiences on minimum wages, including in Brazil, Mauritius, Kenya, Germany, Malaysia and the United Kingdom. During the first quarter discussions were held on codes of conducts during and prior to industrial action.
KPI 8 KPI 8 On-going work: Monitoring the Youth Employment Accord • The Youth Employment Accord was signed with NEDLAC constituencies on 18 April 2013. • EDD monitors implementation and tables progress reports to Cabinet. • These cover actions in areas such as entrepreneurship and industrial funding, internships and skills development • A detailed report is being prepared, to be finalised during the current quarter of 2015
Snippets on Youth Employment Accord 377 000increase in youth employment since signing of Accord [In the last 2 years sefa disbursed about R568.2 million to 26 714 youth owned enterprises. The IDC disbursed over R149 million to youth owned enterprises.] 28 000 young people were registered as artisans through the SETAs in the 2014/15 financial year, and over 14 300 completed their training Internships are important – for example in the last 2 years SAA provided internships to 153 young people and 83 were successfully employed thereafter 405 742 young people trained in EPWP from 2013/14 to 2014/15
CASE STUDY: Youth entrepreneurship CASE STUDY: Youth Entrepreneur • IDC approved R13.8 million for a furniture manufacturer • One of the owners was a youth entrepreneur • The business makes lounge suites and had been negatively affected by the demise of Ellerines • IDC’s funding ensured that the business overcame these difficult times, without the need to retrench workers - they are currently employing 150 workers. If sales sufficiently recover, a further 36 people could be employed.
KPI 9 KPI 9 Work completed: Cabinet level reports 18 SIPs reports were developed for Cabinet. The Report noted that R54,8 billion was spent on infrastructure in the quarter to March 2015 by the public sector, excluding projects facilitated by the state through the renewable energy programme. Of this sum spent, the PICC tracked projects that spent R36 billion over this period and provided Cabinet with reports that set out progress on construction and planning. The results were used by the PICC Council and the July 2015 Cabinet Lekgotla. Implementation of the projects and operational responsibility remains with the relevant line departments.
KPI 10 KPI 10 Work completed: Unblocking infrastructure projects • Regulatory issues: EDD facilitated the unblocking of 1 Air Emissions Licence and 4 Environmental Impact Assessment's (EIAs) affecting five infrastructure projects, to ensure that they were issued on time so that projects could be implemented. • Financing: The Ministry engaged the private sector and financiers on behalf of the PICC on the national infrastructure rollout and the requirements and opportunities for financing of assets with a long-term investment horizon. This included a major policy engagement with ASISA, an association that manages more than R4 trillion of investible funds. • Skills development: The Ministry engaged South African project managers from the public and private sectors on the needs of the National Infrastructure Plan and the skills required from developmentally-oriented managers.
KPI 10 Case study: Regulatory unblocking The following regulatory authorisations were unblocked to ensure they were issued on time so that projects could commence or continue: • AEL – Air emissions licence for Medupi unblocked • EIA – Construction Kusile Ash and Gypsum co-disposal facility & associated infrastructure • EIA – Mzimvubu Project: Construction of Roads Infrastructure • EIA – Mzimvubu Project: Ntabelanga-Laleni Conjunctive Scheme and associated infrastructure • EIA – Mzimvubu Project: Electricity Generation and Associated infrastructure
CABLE AND METAL THEFT • Theft of copper and metal from public infrastructure causes serious economic harm and social disruption • This affects transport systems (rail cables and lines; road signs), energy (cables and metal from distribution systems), water (pipes, taps and metal from water treatment works), communications (copper cables), social infrastructure (clinics, schools, households) • The PICC approved a package of measures in December 2014 • Drafting of a Bill to address ways to strengthen action against metal and cable thieves commenced thereafter
KPI 11 KPI 11 Work completed: Criminal Matters Amendment Bill EDD worked with lawyers, the NPA, PICC Secretariat, Security Cluster and the Department of Justice to identify proposed legislation to address cable and metal theft on the public infrastructure programme. This resulted in a Criminal Matters Amendment Bill. EDD worked with the Department of Justice to pilot the amendments through Cabinet in June 2015.
Infrastructure: new Bill on cable theft The amendments: • Provide for changes to the laws pertaining to infrastructure-related offences such as cable theft and create a new offence for damage to essential infrastructure • Set out stricter provisions for the granting of bail • Introduces minimum sentencing periods for certain types of offences. • Aims to safeguard infrastructure and thus ensure that the country can meet its economic growth targets and increase employment
KPI 12 KPI 12 Work completed: PICC meetings held and facilitated During the quarter, EDD provided technical, secretariat and coordinating support for the hosting of PICC structures, including one PICC Council meeting, seven PICC Secretariat meetings (attended by Ministers and Deputy Ministers) and SIP Coordinator meetings. These structures prepared and finalised the submissions discussed by Cabinet.
KPI 13 This included a critical review of investment opportunities identified by the project team, identifying needs of local communities to ensure that new investment benefit local economic development and what blockages need to be addressed. KPI 13 Work completed: Drive implementation of SIP 5 SIP 5 aims to integrate development and integration between the Northern Cape and Saldanha and expand iron-ore mining, industrial beneficiation and export activities. During the quarter, the Minister convened a meeting with the technical team to receive an update at the start of the new financial year and guide the work on implementation.
KPI 14 EDD played a key role in the development of a local manufacturing strategy for minibus taxis. During the quarter, the Minister • engaged with the management and workforce of Toyota SA • attended the launch of the new Quantum taxi which was produced with a significantly higher local content • discussed opportunities for black industrialists to be integrated in the auto supply-chain and • engaged young workers and professionals at Toyota’s plant in eThekwini during Youth Month Case study: Minibus manufacturing in South Africa
KPI 14 Case study: Clothing manufacturing in South Africa. Employment opportunities in the clothing industry requires dedicated localisation initiatives. EDD worked with partner departments and DFI’s to reverse the loss of productive capacity and jobs in the clothing industry. During the quarter, the Minister: • engaged with Foschini and its local supplier, Prestige Clothing, as an example of a local manufacturer who is able to retain and expand market share through high levels of production efficiencies • visited the factory to track changes made to work organisation • engaged the management on productivity improvements made possible through the government incentive schemes; and • addressed workers at the company on their experiences of the workplace partnership