Download
1 / 22
220 likes | 224 Vues
This chapter discusses the selection of auxiliary variables in surveys to improve bias and variance reduction. It covers the rationale, practical requirements, examples, and strategies for selecting auxiliary variables. Various approaches and considerations for qualitative and quantitative variables are also provided. The level of availability of auxiliary variables and their impact on bias reduction is examined.

E N D
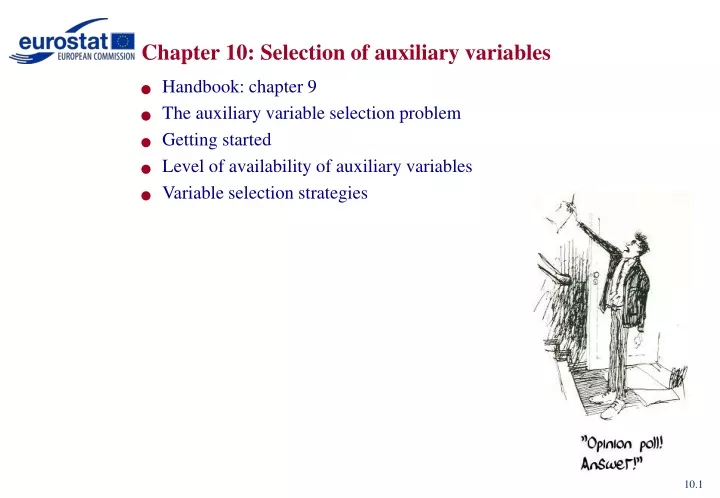
Chapter 10: Selection of auxiliary variables • Handbook: chapter 9 • The auxiliary variable selection problem • Getting started • Level of availability of auxiliary variables • Variable selection strategies
Response behavior:R Auxiliary variable: X Target variable:Y The auxiliary variable selection problem Bias of response mean: Bounds on correlation:
The auxiliary variable selection problem • Rationale behind selection of auxiliary variables • Without nonresponse: Auxiliary variables need to relate to key survey topics for variance reduction • With nonresponse: Auxiliary variables need to relate to key survey topics and/or response behaviour for bias and variance reduction. • Usual practice • Model for response behaviour • Model for key survey topics • Some combination of both sets of auxiliary variables • Practical requirements • Some auxiliary variables are included for consistency purposes • Weighting models are fixed for longer time period in order to avoid level shifts
The auxiliary variable selection problem – an example • Examples; ownership of a personal computer and house
The auxiliary variable selection problem • Selection and missing-data-mechanisms • Underlying assumption in weighting models is Missing-at-Random (MAR). Within strata defined by auxiliary variables respondents and nonrespondents are the same on average. • Even if final weighting model satisfies MAR then what about smaller intermediate models? MAR assumption does not give guidance to selection of auxiliary variables.
Getting started • Type and level of auxiliary variables important. Three decisions are needed: • Qualitative variables: definition and number of categories • Quantitative variables: transformation to categorical measurement level or higher order terms • Interactions between auxiliary variables
Getting started • Qualitative variables (type of household or business, etnicity): • Use publication classifications of variables (often required also for consistency) • Perform an exploratory analysis based on tree methods like CHAID and follow categories identified as most powerful
Getting started • Quantitative variables (income, turnover, age): • Usually transformed to categorical variables, unless intrinsic motivation to use continuous variable. Higher order terms (quadratic, cubic) may be added. • Transformation to categorical variables again using standard publication classifications or using regresssion trees.
Getting started • Interactions strongly increase the number of adjustment parameters, i.e. caution is needed in adding interactions • Motives for inclusion of interactions • Consistency • Collinearity • Interactions relate to nonresponse behaviour • Interactions relate to target variables
Level of availability of auxiliary variables • Population level: Auxiliary variable is available for all individuals through linked registry or frame data (ideal situation). • Sample level: Auxiliary variable is available only for sample units through paradata observations made by interviewers and data collection staff • Aggregated population level: Auxiliary variable is available for respondents and in population tables or counts.
Level of availability of auxiliary variables • From a bias reduction point of view, there is no difference between population level and sample level auxiliary variables. • Aggregated population level variables are produced by National Statistical Institutes (NSI`s) and are often used as golden standards. • Sample level and aggregated population level auxiliary variables need to be included in the questionnaire or interviewer observations! In other words, variable selection starts in the design of the survey.
Variable selection strategies • Pre-selection of auxiliary variables from literature on similar surveys; • Linkage of available population level variables from registrations; • Inclusion of additional auxiliary variables in the survey questionnaire; • Identification and observation of additional paradata by interviewers and data collection staff; • Modeling of the missing-data-mechanism of nonresponse; • Modeling of the main survey variables; • Combination of auxiliary variable sets from the models resulting from steps 5 and 6; • Checking of weight diagnostics and if necessary return to step 7;
Variable selection strategies • Combination of auxiliary variable sets is not at all trivial, unless the number and diversity of the target variables is very large. • When the number and diversity of target variables is large, it is sufficient to model nonresponse. • Advanced selection strategies account for relation to target variables and nonresponse simultaneously: • Särndal and Lundström (2010): Coefficient of variation of adjustment weights. • Schouten (2007): Maximal bias of regression estimator under worst-case scenario
Variable selection strategies – coefficient of variation • Särndal and Lundström proved that coefficient of variation is standard term in remaining bias of general regression estimators, i.e. regardless of Y • It is denoted by • Without a specific Y in mind, it is generally the best choice to optimize the variation of adjustment weights.
Variable selection strategies – maximal bias • Bias of general regression estimator • Let be the predictor of Y based on X. Then • Objective: minimize bias under worst-case scenario, i.e. at boundaries of interval
Variable selection strategies – maximal bias • Selection of auxiliary variables under worst case scenario • Observe that is independent of the choice of auxiliary variables. • Maximal bias using the vector X of auxiliary variables is proportional to • Select auxiliary variables according to • Properties of selection criterion • It allows for building up weighting models bottom-up • It leads to different models for each Y
Variable selection strategies - general • Implementation of selection criterion • Need to account for significant decrease of criterion, i.e. accounting for variance. • Implementation • Analogous to regression analysis. Select forwards and remove backwards. • Classification trees that use criterion as split rule and significance of decrease as stopping rule
Example 1 – variance of adjustment weights Forward selection – backward removal
Example 2 – maximal bias Forward selection – backward removal
Example 2 - continued Forward selection – backward removal (Population is 12.1%)
Receives social allowance node 1 55-64 y node 2 node 3 20-54 y Job node 12 node 13 node 4 node 5 Male Job node 14 node 15 node 6 node 7 WOZ 50-250 Couple with children Married Divorced node 20 node 21 node 26 node 27 node 30 node 31 node 8 node 9 Age mar WOZ<150 Couple no children node 28 node 29 node 16 node 17 node 10 node 11 Male <29 y node 24 node 25 node 18 node 19 <10% non-native WOZ 125-400 node 32 node 33 node 22 node 23 Example 2 - continued Classification tree
The selection of auxiliary variables • Conclusions • The strongest candidate auxiliary variables are those that relate both to the key survey topics and the missing-data-mechanism. • Even if MAR is assumed one needs a criterion to build and to differentiate between models • Selection of auxiliary variables is often a laborious and partially manual process. • Simultaneous adjustment of large number of survey target variables complicates selection. • An efficient search for stratifications leads to nonresponse adjustments that are as effective as models incorporating many variables and interactions.