Download
1 / 41
410 likes | 414 Vues
U.S. Ethanol Industry Outlook: Socio/Economic Impact of Booming Ethanol Industry Bruce A. Babcock Center for Agricultural and Rural Development Iowa State University Presented at the ProBeef 07 Ames, Iowa September 5, 2007. Overview.

E N D
U.S. Ethanol Industry Outlook: Socio/Economic Impact of Booming Ethanol Industry Bruce A. Babcock Center for Agricultural and Rural Development Iowa State University Presented at the ProBeef 07 Ames, Iowa September 5, 2007
Overview • Review where we are with ethanol and where we are going under current policies and oil prices • What would happen if oil prices rise? • What would happen if drought hit the U.S. Corn Belt?
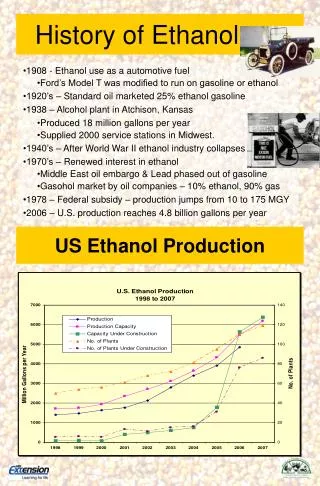
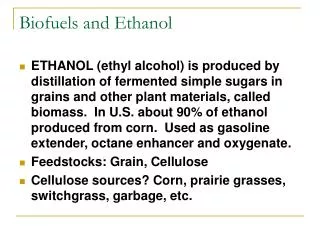
U.S. Ethanol Industry • Current ethanol capacity: 6.5 billion gallons/year • Total capacity under construction and expansion: 6.5 billion gallons/year • 77 new ethanol plants and 8 expansion projects underway • 2.2 billion bushels of corn were used in producing fuel ethanol in 2006/2007 marketing year. • 3.2 billion bushels of corn are expected to be used in producing fuel ethanolfor 2007/2008 marketing year. • At 13 billion gallons, corn use = 4.7 billion bushels = 30 million acres
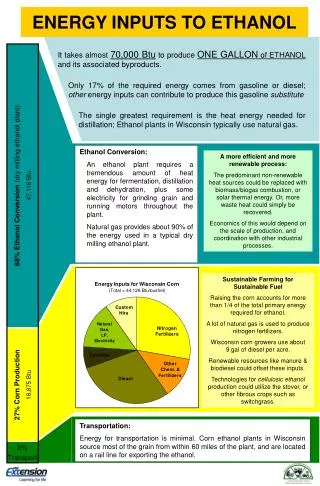
U.S. Biodiesel Industry • Current capacity: 1.2 billion gallons/year • Total capacity under construction and expansion: 0.7 billion gallons/year • Carriquiry calculates that sales were less than 300 million gallons in 2006 • FAPRI also projects less than 30% capacity utilization because of low or negative operating margins
■ ■ Actual Planted Acreage in 2007
Importance of Margin • Without prospect of a positive margin, ethanol plants will not get built • With plants operating at full capacity there is a corn price that shuts down ethanol plants, freeing up corn to feed livestock • If there is excess capacity, there is a corn price that will cause plants to run at full capacity • Both floor and ceiling prices are determined by price of gasoline.
Plant will shut-down Plant will operate
Three Scenarios • Price of gasoline falls to $1.00/gallon after 14 billion gallons of ethanol capacity is built • Price of corn will be bid up to $2.50 per bushel • Price of gasoline remains at $2.00/gallon, 35 million acres needed to run ethanol plants • Price of corn will be above $3.30/bu, but will not rise above $4.75/bu even under short crop conditions • Price of gasoline rises to $2.25 per gallon because crude oil prices increase $10 above baseline levels
Impact of Higher Crude Oil Price • Increased crude oil price by $10/barrel over the projection • Margins on ethanol plants increase • New incentive to invest in added capacity for ethanol production • Eventually, a new equilibrium reached where there is no incentive to invest in or exit the ethanol industry • Will demand for ethanol be enough? • E-10 market will saturate around 15 billion gallons • Drop in ethanol price relative to gasoline will eventually encourage increase in demand for the flex-fuel cars
Farm to Retail Food Price Spread Source: USDA-Economic Research Service, 2001
Impact on Rest of the World • World grain and oilseed prices increase • Result in higher feed and food prices • Higher food prices • Higher livestock production cost • Countries in South America and Asia fill the gap
Impact of Short Crop Scenario • Drought in 2012 similar to 1988 • Regional yields of corn, soybeans and wheat changed from trend levels • Yields were off by 25% for corn, 18% for soybeans, and 11% for wheat in 1988 • Ethanol mandate for 2012 assumed to be 14.7 billion gallons
Corn, Soybean and Ethanol Markets • Corn price increases by 44% above baseline levels • Soybean price rises by 22% • Corn exports and stock levels decline by more than 60% • Corn exports from South America, China, etc. fill part of the gap from decline in U.S. corn exports • Corn feed use declines by 16% (switch to other feeds) • Ethanol trade increases moderately
Livestock Market • Higher feed costs affect the livestock sector but to a lesser extent as shock is perceived as temporary • Production declines • Broiler production declines the most (over 2.5%) • Milk production declines the least (0.5%) • Retail prices increase • Egg prices increase the most (about 5.5%) • Prices of other products increase by a range between 2% and 4%
Conclusions • U.S. biofuels policy choices combined with the price of crude oil will determine future feed prices • Food prices primarily determined by factors other than the price of feed • Cellulosic ethanol will not replace corn-based ethanol without a change in policy incentives