Download
1 / 81
900 likes | 1.23k Vues
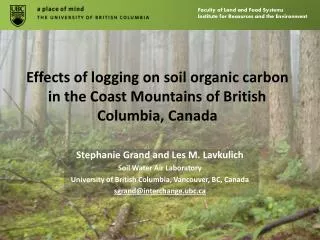
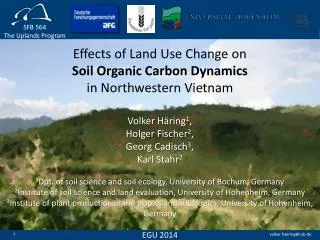
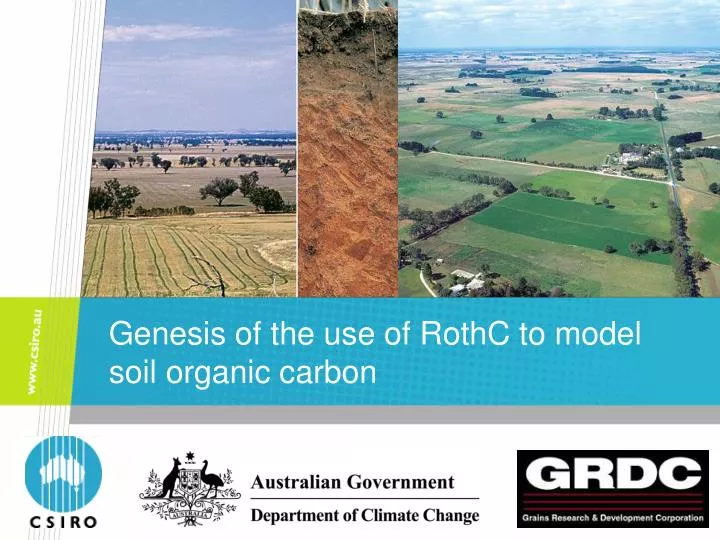
Genesis of the use of RothC to model soil organic carbon. Outline. Composition of soil organic carbon – isolating biologically important fractions Methodology for quantifying C allocation to fractions Why attempt to understand allocation to fractions? Modelling soil carbon with RothC

E N D
Outline • Composition of soil organic carbon – isolating biologically important fractions • Methodology for quantifying C allocation to fractions • Why attempt to understand allocation to fractions? • Modelling soil carbon with RothC • Substitution of conceptual with measureable C pools in RothC • MIR prediction of soil carbon fractions CSIRO. Soil carbon modelling workshop Adelaide 25-26/06/2008
Crop residues on the soil surface (SPR) • Buried crop residues (>2 mm) (BPR) • Particulate organic matter (2 mm – 0.05 mm) (POC) • Humus (<0.05 mm) (HumC) Extent of decomposition increases Rate of decomposition decreases C/N/P ratio decreases (become nutrient rich) • Resistant organic matter (ROC) Dominated by charcoal with variable properties Composition of soil organic matter CSIRO. Soil carbon modelling workshop Adelaide 25-26/06/2008
Biologically significant soil organic fractions Particulate material (POC) Humus (HumC) Charcoal (ROC) CSIRO. Soil carbon modelling workshop Adelaide 25-26/06/2008
Quadrat collection Surface plant residue carbon Soil sieved to >2mm Soil sieved to <2mm Na saturate, disperse, sieve <53 µm Density fractionation >53 µm fraction <53 µm fraction Buried plant residue carbon Density fractionation Humus + recalcitrant Particulate organic carbon HF treatment, UV-PO, & NMR Recalcitrant Charcoal C Quantifying SOC allocation of SOC to fractions Total soil organic carbon Humus = <53µm - Recalcitrant CSIRO. Soil carbon modelling workshop Adelaide 25-26/06/2008
25 20 15 10 5 0 Variation in amount of C associated with soil organic fractions Surface plant residue C (SPR) Buried plant residue C (BPR) (Mg C/ha) Organic carbon in 0-10 cm layer Particulate organic carbon (POC) Humus C (HumC) Recalcitrant C (ROC - charcoal) Average for Hamilton (long term pasture) CSIRO. Soil carbon modelling workshop Adelaide 25-26/06/2008
Variation in amount of C associated with soil organic fractions 30 SPR 25 BPR POC 20 HumC ROC 15 Organic C in 0-10 cm layer (Mg C/ha) 10 5 0 0P 1P 8P 11P 22P 32P W2PF Arboretum Pulse/wheat Strat (MedN) Strat (HighN) Canola/wheat Perm Pasture NoTill (MedN) NoTill (HighN) Pasture/wheat Hamilton Hart Yass Urrbrae Waikerie Pasture Cropped Pasture Mix Mix CSIRO. Soil carbon modelling workshop Adelaide 25-26/06/2008
Total soil organic C 30 Conversion to permanent pasture 25 20 Soil organic carbon (g C kg-1 soil) 15 10 5 10 y 18 y 0 10 20 30 50 0 40 70 60 15 33 43 Years Changes in total soil organic carbon with time Initiate wheat/fallow CSIRO. Soil carbon modelling workshop Adelaide 25-26/06/2008
Initiate wheat/fallow TOC 30 Humus C POC Conversion to permanent pasture 25 ROC 20 Soil organic carbon (g C kg-1 soil) 15 ~30% less humus C 10 5 10 y 18 y ~800% more POC 0 10 20 30 50 0 40 70 60 15 33 43 Years Importance of allocating C to soil organic fractions CSIRO. Soil carbon modelling workshop Adelaide 25-26/06/2008
Initiate wheat/fallow TOC Humus Conversion to wheat/fallow POC ROC 10 y 18 y 9 y 52 Vulnerability of soil carbon content to variations in management practices 30 25 Conversion to pasture 20 Soil organic carbon (g C kg-1 soil) 15 10 5 0 10 20 30 50 0 40 70 60 43 15 33 Years CSIRO. Soil carbon modelling workshop Adelaide 25-26/06/2008
10 g Char-C kg-1soil 2.5 g Char-C kg-1soil Active C Active C Inert C Inert C Importance of quantifying allocation of C to soil organic fractions Soil 2 20 g SOC kg-1 soil Soil 1 20 g SOC kg-1 soil 25 25 20 20 15 Soil Organic Carbon (g C kg-1 soil) Soil Organic Carbon (g C kg-1 soil) 15 10 10 5 5 0 0 Time Time CSIRO. Soil carbon modelling workshop Adelaide 25-26/06/2008
Quadrat collection Surface plant residue carbon Soil sieved to >2mm Soil sieved to <2mm Na saturate, disperse, sieve <53 µm Density fractionation >53 µm fraction <53 µm fraction Buried plant residue carbon Density fractionation Humus + recalcitrant Particulate organic carbon HF treatment, UV-PO, & NMR Recalcitrant Charcoal C Summary SOC fractions Total soil organic carbon Humus = <53µm - Recalcitrant CSIRO. Soil carbon modelling workshop Adelaide 25-26/06/2008
DPM RPM CO2 Decomposition CO2 Decomposition BIO BIO HUM Decomposition HUM IOM Fire RothC Model (Version 26.3) Plant Inputs Original configuration – monthly time step CSIRO. Soil carbon modelling workshop Adelaide 25-26/06/2008
Roth C data requirements • Monthly climate data: rainfall (mm), open pan evaporation (mm), average monthly air temperature (°C) • Soil clay content (% soil OD mass) • Soil cover (vegetated or bare) • Monthly plant residue additions (t C ha-1) • Decomposability of plant residue additions • Monthly manure additions (t C ha-1) • Soil depth (cm) • Initial amount of C contained in each pool CSIRO. Soil carbon modelling workshop Adelaide 25-26/06/2008
RothC model structure – partitioning residue inputs into decomposable and resistant material • All plant material entering the soil is partitioned into DPM and RPM via DPM/RPM ratio CSIRO. Soil carbon modelling workshop Adelaide 25-26/06/2008
Values of k for each SOC fraction (y-1) BioF BioS DPM RPM Hum 0.66 0.66 10 0.15 0.02 RothC model structure – amount of each type of carbon decomposed • The amount of carbon associated with each pool that decomposes follows an exponential decay a = the rate modifying factor for temperature b = the plant retainment rate modifying factor c = the rate modifying factor for soil water k = the annual decomposition rate constant for a type of carbon t = 0.0833, since k is based on a yearly decomposition rate. CSIRO. Soil carbon modelling workshop Adelaide 25-26/06/2008
Plant retainment modifying factor (b) b = 0.6 if soil is vegetated b = 1.0 if soil is bare RothC model structure – calculation of rate constant modifying factors • Temperature modifying factor (a) tm= average monthly temperature CSIRO. Soil carbon modelling workshop Adelaide 25-26/06/2008
Saturation Upper Limit Water present in the soil (mm) Total porosity TSMD Lower Limit Dry RothC model structure – calculation of rate constant modifying factors • Soil water modifying factor – calculated based on top soil moisture deficit (TSMD) CSIRO. Soil carbon modelling workshop Adelaide 25-26/06/2008
Calculation of accumulated TSMD over each time step under the constraint that the accumulated TSMD can only vary between 0 and MaxTSMD RothC model structure – calculation of rate constant modifying factors • Calculation of maximum TSMD CSIRO. Soil carbon modelling workshop Adelaide 25-26/06/2008
RothC model structure – calculation of rate constant modifying factors • Calculation of the rate modifying factor (c) if TSMDacc < 0.444 MaxTSMD then c=1.0 otherwise, 1.0 c 0.2 MaxTSMD 0.444 MaxTSMD CSIRO. Soil carbon modelling workshop Adelaide 25-26/06/2008
Values of k for each SOC fraction (y-1) BioF BioS DPM RPM Hum 0.66 0.66 10 0.15 0.02 RothC model structure – amount of each type of carbon decomposed • The amount of carbon associated with each pool that decomposes follows an exponential decay a = the rate modifying factor for temperature b = the plant retainment rate modifying factor c = the rate modifying factor for soil water k = the annual decomposition rate constant for a type of carbon t = 0.0833, since k is based on a yearly decomposition rate. CSIRO. Soil carbon modelling workshop Adelaide 25-26/06/2008
DPM RPM CO2 Decomposition CO2 Decomposition BIO BIO HUM Decomposition HUM IOM Fire RothC Model (Version 26.3) Plant Inputs CSIRO. Soil carbon modelling workshop Adelaide 25-26/06/2008
RothC model structure – partitioning of decomposition products • Fraction decomposing organic matter that goes to CO2, humus and biomass • Partitioning to CO2 is defined by clay content Biomass + Humus partitioning 46% Bio 54% Hum CSIRO. Soil carbon modelling workshop Adelaide 25-26/06/2008
RothC output under constant inputs and climate – to define equilibrium SOC CSIRO. Soil carbon modelling workshop Adelaide 25-26/06/2008
DPM RPM CO2 Decomposition CO2 Decomposition BIO BIO HUM Decomposition HUM IOM Fire Modelling the measurable Plant Inputs RPM = POC IOM = ROC (Charcoal C) HUM = TOC – (POC + ROC) CSIRO. Soil carbon modelling workshop Adelaide 25-26/06/2008
Requirements for calibration CSIRO. Soil carbon modelling workshop Adelaide 25-26/06/2008
Calibration Sites Verification Sites Brigalow Tarlee 0 350 700 Kilometres Model calibration and verification sites CSIRO. Soil carbon modelling workshop Adelaide 25-26/06/2008
Brigalow calibration site: influence of modifying RPM decomposition constant (k) CSIRO. Soil carbon modelling workshop Adelaide 25-26/06/2008
60 50 40 Measured 40 30 Soil C (t/ha) Soil C (t/ha) 20 20 DPM 10 RPM 0 0 1970 1980 1990 2000 1988 1990 1992 1994 1996 1998 HUM Year Year IOM Modeled BIO Soil POC Salmon Gums - wheat/ 3 pasture Salmon Gums – wheat/wheat HUM 50 50 CHAR 40 40 30 30 TOC Soil C (t/ha) Soil C (t/ha) 20 20 10 10 0 0 1979 1983 1987 1991 1979 1983 1987 1991 Year Year Model Verification: (sites with archived soil samples) Wagga – wheat/pasture Tamworth – wheat/fallow CSIRO. Soil carbon modelling workshop Adelaide 25-26/06/2008
Is this result due poor model performance or poor pairing of the sites? Did the sites start off similar or were there significant initial differences in soil/plant/environmental properties? 50 Kindon - pasture 15 y Dunkerry South - crop 40 30 30 Soil C (t/ha) 20 20 Soil C (t/ha) 10 10 0 1986 1991 1996 2001 0 Year 1967 1977 1987 1997 DPM Year RPM Measured Modeled HUM IOM POC CHAR BIO HUM TOC Soil Model verification: (paired sites) CSIRO. Soil carbon modelling workshop Adelaide 25-26/06/2008
Quadrat collection Surface plant residue carbon Soil sieved to >2mm Soil sieved to <2mm Na saturate, disperse, sieve <53 µm Density fractionation >53 µm fraction <53 µm fraction Buried plant residue carbon Density fractionation Humus + recalcitrant Particulate organic carbon HF treatment, UV-PO, & NMR Recalcitrant Charcoal C Quantifying SOC allocation of SOC to fractions Total soil organic carbon Humus = <53µm - Recalcitrant CSIRO. Soil carbon modelling workshop Adelaide 25-26/06/2008
Fourier Transform Infrared Spectrum 4 3 Intensity 2 1 5000 4500 4000 3500 3000 2500 2000 1500 1000 500 Frequency (cm-1) Predicting total organic carbon and its allocation to SOC fractions using MIR • Dependence on soil chemical properties • Prediction of allocation of carbon to fractions via calibration and PLS CSIRO. Soil carbon modelling workshop Adelaide 25-26/06/2008
Prediction of total organic carbon (TOC) 177 Australian soils (all states) from varying depths within the 0-50 cm layer n = 177 Range: 0.8 – 62.0 g C/kg R2 = 0.94 MIR predicted TOC (g C/kg soil) Measured TOC (g C/kg soil) Janik et al. 2007 Aust J Soil Res 45 73-81 CSIRO. Soil carbon modelling workshop Adelaide 25-26/06/2008
Tasmanian soils project CSIRO. Soil carbon modelling workshop Adelaide 25-26/06/2008
MIR prediction of particulate organic carbon 141 Australian soils (all states) from varying depths within the 0-50 cm layer n = 141 Range: 0.2 – 16.8 g C/kg R2 = 0.71 MIR predicted POC (g C/kg soil) Variability in crop residue type exits Measured POC (g C/kg soil) Janik et al. 2007 Aust J Soil Res 45 73-81 CSIRO. Soil carbon modelling workshop Adelaide 25-26/06/2008
MIR prediction of charcoal C 121 Australian soils (all states) from varying depths within the 0-50 cm layer n = 121 Range: 0.0 – 11.3 g C/kg R2 = 0.86 MIR predicted Char C (g/kg) Measured Char C (g/kg) Janik et al. 2007 Aust J Soil Res 45 73-81 CSIRO. Soil carbon modelling workshop Adelaide 25-26/06/2008
Summary • Methodologies exist to quantify biologically significant pools of carbon • Understanding the dynamics of the pools allows accurate interpretation of potential changes • Substitution of measureable fractions for conceptual pools in models is possible • Rapid methods for predicting soil carbon allocation to pools exist CSIRO. Soil carbon modelling workshop Adelaide 25-26/06/2008
CSIRO Land and Water Jeff Baldock Research Scientist Phone: +61 8 8303 8537 Email: jeff.baldock@csiro.au Web:http://www.clw.csiro.au/staff/BaldockJ/ Acknowledgements Jan Skjemstad, Kris Broos, Evelyn Krull, Ryan Farquharson, Steve Szarvas, Leonie Spouncer, Athina Massis Thank you Contact UsPhone: 1300 363 400 or +61 3 9545 2176Email: Enquiries@csiro.au Web: www.csiro.au
Measured 70 DPM 60 RPM HUM 50 IOM Modeled 0-30 cm Soil C (t/ha) 40 BIO Soil 30 POC 20 HUM CHAR 10 TOC 0 1982 1987 1992 1997 Year Model Calibration Brigalow South ws64 (RPM 0.15) CSIRO. Soil carbon modelling workshop Adelaide 25-26/06/2008
Defining soil C dynamics at Roseworthy, SA under continuous wheat production Equilibrium conditions (model for 500 years) CSIRO. Soil carbon modelling workshop Adelaide 25-26/06/2008
Changes in soil C for different levels of average grain yield CSIRO. Soil carbon modelling workshop Adelaide 25-26/06/2008
Changes in soil C for different levels of average grain yield Shift yield from 4 to 8 T grain/ha = 1.0 %C increase over 20 years Shift yield from 4 to 6 T grain/ha = 0.4 %C increase over 20 years CSIRO. Soil carbon modelling workshop Adelaide 25-26/06/2008
Composition of methodologically defined SOC fractions Particulate organic carbon (POC) • Fragments of plant residues >53 µm (living and dead) • Molecules sorbed to mineral particles >53 µm • Large pieces of charcoal Humus (HUM-C) • Fragments <53 µm • Molecules sorbed to particles <53 µm Recalcitrant (ROC) • Materials <53 µm that survive photo-oxidation • Dominated by material with a charcoal-like chemical structure • NMR to quantify char-C CSIRO. Soil carbon modelling workshop Adelaide 25-26/06/2008
TOC Inert OC W F 200 W F 35 35 35 35 35 P P F W 35 35 35 35 200 34 34 34 34 32 P P F W 34 34 34 33 33 33 33 P P F W 31 31 31 180 33 33 33 32 32 32 32 30 30 30 P P F W 32 32 31 31 31 31 Perm. Past. 29 29 29 180 30 30 30 30 Contour bank 160 29 29 29 29 W O O(g) F 27 27 27 28 W O O(g) F 26 26 26 26 26 26 160 27 27 27 27 W O O(g) F 25 25 25 25 25 25 140 26 W O O(g) F 24 24 24 24 24 24 25 B Pe W 23 23 23 23 23 23 ) 24 140 B Pe W 22 22 22 22 22 22 m ( 23 B Pe W 21 21 21 21 21 21 120 y 0.50 r 22 ) a W P P 20 20 20 20 20 20 m 2.40 d 21 ( n W P P 19 19 19 19 19 19 120 u y r 20 o W P P a 0.45 B 100 d 19 W W n 17 17 17 17 17 17 n r u 2.00 18 e 18 18 18 o W W P P P P P 16 16 16 16 16 16 18 18 18 h B 100 t 17 0.40 r W W P P P P P 15 15 15 15 15 15 n o r 80 16 N e W W P P P P P 14 14 14 14 14 14 h t 15 W W P P P P P r 13 13 13 1.60 13 13 13 o 0.35 14 80 N W W P P P P P 12 12 12 12 12 12 13 W W P P P P P 11 11 11 60 11 11 11 12 0.30 W O F 10 10 10 10 10 10 1.20 11 W O F 9 9 9 9 9 9 60 10 W O F 8 8 8 8 8 8 40 0.25 9 W O(g) F 7 7 7 7 7 7 0.80 8 W O(g) F 6 6 6 6 6 6 40 7 W O(g) F 5 5 5 5 5 5 0.20 20 6 W Pe 4 4 4 4 4 4 5 W Pe 3 3 3 0.40 3 3 3 4 0.15 20 Perm. Past 2 2 2 2 2 2 3 Perm. Past 1 1 1 1 1 1 0 0 0 2 0.10 0.00 1 0 0 25 50 75 100 0 25 50 75 100 Western Boundary (m) Western Boundary (m) Spatial variation in soil charcoal and carbon contents (0-10 cm layer) CSIRO. Soil carbon modelling workshop Adelaide 25-26/06/2008
Predicting soil organic carbon contents • Clearing of Brigalow bushland CSIRO. Soil carbon modelling workshop Adelaide 25-26/06/2008
Options for increasing soil carbon content • Principal: increase inputs of carbon to the soil • Maximise capture of CO2 by photosynthesis and addition of carbon to soil • Options • Maximise water use efficiency (kg total dry matter/mm water) • Maximise stubble retention • Introduction of perennial vegetation • Alternative crops - lower harvest index • Alternative pasture species – increased below ground allocation • Addition of offsite organic materials – diversion of waste streams • Green manure crops – legume based for N supply CSIRO. Soil carbon modelling workshop Adelaide 25-26/06/2008
Options for increasing soil carbon content • Constraints • Soil type – protection and storage of carbon • Local environmental conditions • Dryland conditions – amount and distribution of rainfall • Irrigation – maximise water use efficiency • Economic considerations – alterations to existing systems must remain profitable • Social • Options need to be tailored to local conditions and farm business situation CSIRO. Soil carbon modelling workshop Adelaide 25-26/06/2008
Defining inputs of organic carbon to soil – dryland conditions • Availability of water – amount and distribution of rainfall imposes constraints on productivity and options CSIRO. Soil carbon modelling workshop Adelaide 25-26/06/2008
Reactive surfaces Depth Bulk density Defining factors Potential sequestration Limiting factors Rainfall Temperature Light Attainable sequestration Soil management Plant species/crop selection Residue management Soil and nutrient losses Inefficient water and nutrient use Disrupted biology/disease Reducing factors Soil carbon sequestration situation Actual sequestration SOCactual SOCpotential SOCattainable Stable soil organic carbon (e.g. t1/2³ 10 years) Evaluating potential C sequestration in soil Optimise input and reduce losses Add external sources of carbon CSIRO. Soil carbon modelling workshop Adelaide 25-26/06/2008
$$ for C sequestration – fact or fiction • There is no doubt that soils could hold more carbon • Challenge – increase soil C while maintaining economic viability • Options • Perennial vegetation • Regions with summer rainfall • Portions of paddocks that give negative returns • Reduce stocking, rotational grazing, green manure • Optimise farm management to achieve 100% of water limited potential yield • External sources of carbon • Under current C trading prices • Difficult to justify managing for soil C on the basis of C trading alone • Do it for all the other benefits enhanced soil carbon gives CSIRO. Soil carbon modelling workshop Adelaide 25-26/06/2008