Download
1 / 19
190 likes | 310 Vues
Extratropical Storm-Induced Coastal Inundation: Scituate, MA Model Evaluation Plan March 8, 2011. Steps Tide comparison ( using Scituate tide data ) Wave (alone) comparison ( using NDBC buoy data ) (w/ wo wind adjustment?)

E N D
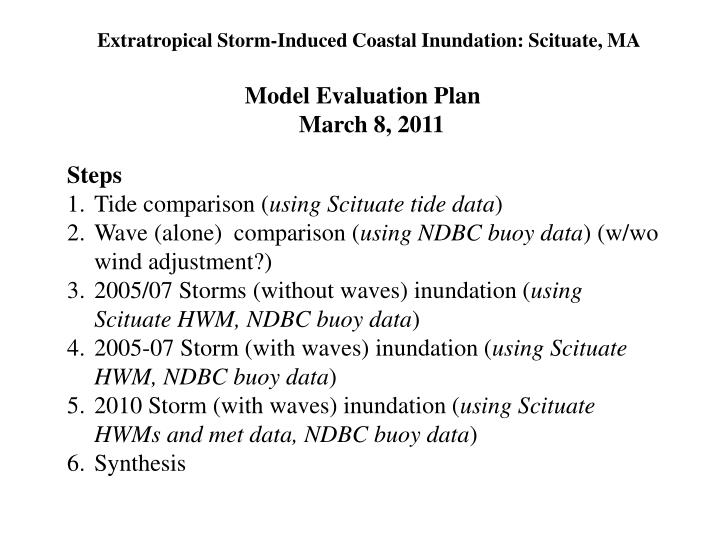
Extratropical Storm-Induced Coastal Inundation: Scituate, MA Model Evaluation Plan March 8, 2011 Steps Tide comparison (using Scituate tide data) Wave (alone) comparison (using NDBC buoy data) (w/wo wind adjustment?) 2005/07 Storms (without waves) inundation (using Scituate HWM, NDBC buoy data) 2005-07 Storm (with waves) inundation (using Scituate HWM, NDBC buoy data) 2010 Storm (with waves) inundation (using Scituate HWMs and met data, NDBC buoy data) Synthesis
The Test Site: Scituate, MA 44013
The Northeast Coastal Ocean Forecast System (NECOFS) grid The Scituate Grid Nested Horizontal Resolution: 10 m to 1 km Cell number: xxxxx Node number: xxxxx
Tide gauge station Met station
Buoys with wave measurements Total 20 stations Station No. Longitude(W) Latitude (N) 44004 70.433 38.484 44005 69.140 43.189 44007 70.144 43.531 44008 69.431 40.500 44009 74.702 38.464 44013 70.691 42.354 44017 72.046 40.691 44018 69.294 41.259 44024 65.927 42.312 44025 73.166 40.250 44027 67.314 44.273 44029 70.570 42.520 44030 70.418 43.183 44031 70.060 43.570 44032 69.358 43.715 44033 69.000 44.060 44034 68.110 44.110 44035 67.020 44.890 44037 67.883 43.484 44038 66.550 43.633 44013
Model-Model Comparisons • Transects • Elevation • Mass Flux • Wave Energy Flux (?) • Points • Tide gauge • E. Foster Bridge • Harbor Master/Town Pier • Cedar Point depression • Jericho Road • Center of harbor mouth transect Model-Data Comparison 44 Rebecca Road
Points and sections in the grid Sites and sections in the model grid STATIONS NODE NUMBER LONGITUDE LATITUDE A 3078 -70.7233658 42.2058182 B 5301 -70.7239990 42.2021598 C 5446 -70.7248611 42.1981239 D 4216 -70.7214050 42.1923218 E 2543 -70.7172089 42.1955299 F 5140 -70.7198868 42.1993752 G 3484 -70.7163010 42.2028236 H 2792 -70.7182312 42.2070961 I 1898 -70.7178879 42.2078705 I A1 H A A2 B2 B G SECTIONS FROM NODE NUMBER LONGITUDE LATITUDE TO NODE NUMBER LONGITUDE LATITUDE Section A 2835 -70.7205048 42.2074432 -70.7176056 42.2053452 Section B -70.7163162 42.2017404 -70.7152786 42.2042465 Section C 3401 -70.7259140 42.1923523 3576 -70.7204742 42.1923676 B1 F C E C1 D C2
The FVCOM Validation for Tidal Simulation Tide Freq Amp (m) Amp error (m) Phase (oG) Phase error (oG) M2 0.0805114 1.2729 0.021 339.21 0.97 N2 0.0789992 0.2858 0.022 43.60 4.79 S2 0.0833333 0.1669 0.018 154.03 8.13 K1 0.0417807 0.1254 0.004 183.54 2.02 O1 0.0387307 0.0988 0.004 76.93 2.46
The 2005 Nor’easter Storm May 25, 05 AM (GMT) Currents-Waves Currents
Site H Winds Sea Level Vertically averaged velocity
Site G (entrance) Winds Sea Level Vertically averaged velocity
2007 Nor’easter Storm Currents April 18 , 04 AM (GMT) Currents-Waves
Site H (flooded area) Winds Sea Level Vertically averaged velocity
Preliminary Results for the December 27 2011 Storm 7 EST Dec. 26 7 EST Dec. 27 7 EST Dec. 28 hΔp/Δx = (10m)(20mb)/200km = 0.1 kg/(ms2) Wind stress (20 m/s) = 1 kg/(ms2) => 10%
Steps Tide comparison (using Scituate tide data) Wave (alone) comparison (using NDBC buoy data) (w/wo wind adjustment?) 2005/07 Storms (without waves) inundation (using Scituate HWM, NDBC buoy data) 2005-07 Storm (with waves) inundation (using Scituate HWM, NDBC buoy data) 2010 Storm (with waves) inundation (using Scituate HWMs and met data, NDBC buoy data) Synthesis