Download
1 / 51
520 likes | 672 Vues
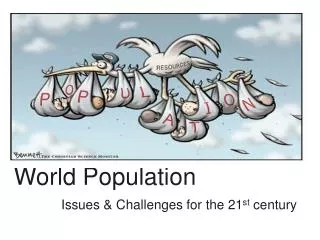
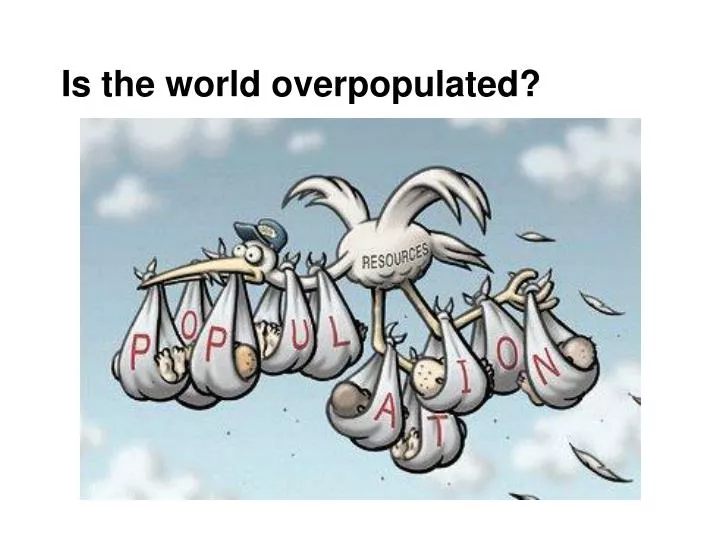
Is the world overpopulated?. Is the world overpopulated?. Siberia. Is the world overpopulated?. Calcutta. Is the world overpopulated?. Africa. Congo. Kenya (Nairobi). Is the world overpopulated?. Why do Western European governments encourage more babies?. What does “overpopulated” mean?.

E N D
Is the world overpopulated? Siberia
Is the world overpopulated? Calcutta
Is the world overpopulated? Africa Congo Kenya (Nairobi)
Is the world overpopulated? Why do Western European governments encourage more babies?
What does “overpopulated” mean? Ethiopia - 70 million - overpopulated Germany - 80 million - not overpopulated (Ethiopia is 3x bigger)
How many humans are there? What is the result of population increase?
Starvation? Malthusian Theory Thomas Malthus - 1798 The world’s population is increasing faster than food supply. (Food supply grows linearly, population grows exponentially.)
Neo-Malthusians Human suffering is occurring on a scale unimagined even by Malthus. Overpopulation must be addressed now.
Questions - How can we make sense of population changes? How can we make predictions? Why is the highest growth rate in underdeveloped states? Why do the richest states have the lowest growth rate? Answers - Demographic Transition Model
Demographic Transition Model a theory which explains human population change
Demographic Transition Model a theory which explains human population change based on • idea that all societies want to transition from pre-modern to postmodern • experience of richer, fully developed states (Europe, US, Australia…)
Stage 1 Pre-modern, hunter-gatherer stage Birth rate high Death rate high What’s going on? Why?
Stage 1 Pre-modern, hunter-gatherer stage What’s going on? Why? high IMR, low life expectancy
Stage 1 Pre-modern, hunter-gatherer stage Total population low, low growth rate Examples no states - only areas of Amazon, remote savannas in Africa, highlands of Papua New Guinea
Stage 2 Urbanizing-Industrializing stage Birth rate high, stable Death rate declines What’s going on? Why?
Stage 2 Urbanizing-Industrializing stage What’s going on? Why? agricultural revolution & technical innovation → specialization & urbanization→ industrialization
Stage 2 Urbanizing-Industrializing stage Total Population population explosion! death rates drop, birth rates remain high → youthful population cultural lag = conditions change, but culture is lagging behind
Stage 2 Urbanizing-Industrializing stage Examples states in Africa, Central America and parts of Southeast Asia (late Stage 2)
Stage 3 Mature Industrial Birth rate declining Death rate declining What’s going on? Why?
Stage 3 Mature Industrial What’s going on? Why? • More people in processing, manufacturing, and service than farming → urbanization → lower TFR • Improved health care, technology, education, etc. • Early Stage 3 very different from Late Stage 3
Stage 3 Mature Industrial More on lower TFR: Urbanization = re-evaluation of costs and benefits of having children. Educated women = more women working, more contraceptive use, fewer kids Cultural lag is over
Stage 3 Mature Industrial Total Population: young people % = older people % Examples: (most states are in Stage 3) early Stage Three - India, Brazil late Stage Three - China, Chile
Stage 4 Fully Developed, Postindustrial Birth rate low, stable Death rate low, stable What’s going on? Why?
Stage 4 Fully Developed, Postindustrial What’s going on? Why? • economic shift has occurred - most people work in service (few in manufacturing, almost none in agriculture) • technology and education still increasing, but can’t lower death rate any more • most people have 1 or 2 children, some have none
Stage 4 Fully Developed, Postindustrial Total Population: older TFR is low Examples: U.S., France, Japan
Stage 5? Does it exist? Birth rate falls below death rate, causing net population loss. Will states disappear?
Population Pyramids show population by gender and age groups • economic conditions • standard of living • future population
Population Pyramids Classic Pyramid
Population Pyramids Classic Pyramid population explosion! Largest age cohorts = under 15 year olds Why does this matter? more dependents than providers Which DT stage(s) have this shape? What else can we predict about a population with this shape?
Population Pyramids Column Shape
Population Pyramids Column Shape stable population growth (low, even zero) closer to replacement level→ more cylindrical in shape replacement level = TFR of 2.1 Which DT stage(s) have this shape? What else can we predict about a population with this shape?
Population Pyramids Inverted
Population Pyramids Inverted total population is shrinking TFR is under 2.1 Why does this happen? Could a state shrink into nonexistence? How could this be avoided?
Population Pyramids Inverted Examples: Japan, Italy, Sweden Why?higher cost of living in urbanized area + transition of children from asset to expense = changed attitudes, lower TFR different kind of example - Russia and former Soviet states - inverted b/c lack of resources, jobs, health care, other services
Population Pyramids and the DTM Which stage? How can you tell?
Population Pyramids and the DTM Which stage? early- to mid-Stage Three How can you tell?
Population Pyramids and the DTM Which stage? How can you tell?
Population Pyramids and the DTM Which stage? late Stage 3, early Stage 4 How can you tell?
Population Pyramids and the DTM Which stage? How can you tell?
Population Pyramids and the DTM Which stage? Stage 4 How can you tell? What else does this pyramid show about India?
Population Pyramids and the DTM population momentum = “snow ball” effect population growth after fertility stabilization (TFR of 2.1)
Use the DT model to predict - What will happen to... ...least developed countries? (sub-Saharan Africa, Middle East, Central America, most of Asia) ...countries further down development path? (China, India, Mexico, South America) ...countries that are fully developed? (W Europe, US / Canada, Australia)
What causes exceptions? religious influences some states in Middle East and South America are maintaining high birth rates state-sponsored policies China - One-Child Policy - wealthy and growing middle class wants to have more children despite penalties