Download
1 / 24
240 likes | 327 Vues
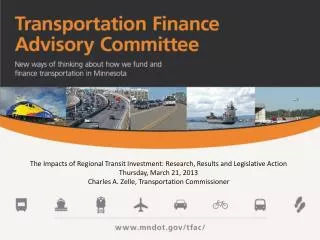
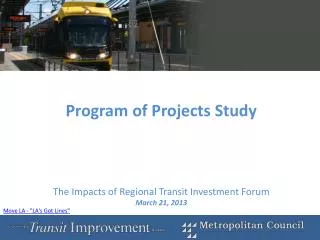
Program of Projects Study The Impacts of Regional Transit Investment Forum March 21, 2013. Move LA - "LA's Got Lines". Regions Ranked by Size of Metro Economy. Source: US Conference of Mayors and the Council for the New American City, U.S. Metro Economics: GMP and Employment Forecast, 2011.

E N D
Program of Projects StudyThe Impacts of Regional Transit Investment ForumMarch 21, 2013 Move LA - "LA's Got Lines"
Regions Ranked by Size of Metro Economy Source: US Conference of Mayors and the Council for the New American City, U.S. Metro Economics: GMP and Employment Forecast, 2011
The Plan: A Program of Projects • Funded by Corridors of Opportunity initiative (March 2011) • Comprehensive new approach to regional development • Accelerate the build-out of the regional transit system .
Shared Regional Vision A regional transit system that will enhance our ability to compete in the global economy, help attract and retain jobs, connect to highways and roads, increase mobility and protect our qualify of life.
The Study: A Program of Projects Components: 6 core projects 9 expansion projects (multiple modes) Total Cost: Capital: up to $5.7 Billion Operating Subsidy: $102 million/year Funding Partners: Federal, State, CTIB and Local Government
Six Core + 9 Expansion Projects • Hiawatha LRT • Northstar Commuter Rail • Cedar Avenue BRT (all phases) • Central Corridor LRT • Southwest LRT • I-35W South BRT (all phases) Core Projects have approved alignments and modes (LPAs) and are in Preliminary Engineering , construction or operation.
BRT plus 3 PoP Scenario Building Blocks 12
Financial Analysis: Program of Projects Study • Is it possible: • To complete our shared vision given current funding practices and policy? • To build our vision more quickly given current funding practices? Sneak peak at the answers: No • How have other cities accelerated their building? • What might work in our region? What are our options?
How have Peer Regions Addressed Funding Challenges? • Capital funding sources? • Financing tools? • Project delivery methods? • Operations and maintenance funding? • Innovative approaches to fast tracking projects?
Peer Cities Findings • All cities defined and developed a specific program of projects. • All cities use sales taxes as the primary local funding source. • All cities use sales taxes for transit and transitway capital and operations. • All cities use FTA New Starts funding • Several of the cities are implementing projects using all non-federal funds. • Most of the cities had to raise their sales tax rate to fund a Program of Projects. • Only two of the seven cities receive state funding.
Conclusions for the Twin Cities • Peer Regions use dedicated sales tax revenue as primary non-federal funding source • Innovative financing is used on the margin, if at all (value added, P3s, etc.) • Current Twin Cities’ dedicated sales tax of 0.25% is insufficient
Sales Tax as a financial building block New Revenue Generated • 0.25% additional sales tax • Additional $100 million/year • 0.50% additional sales tax • Additional $200 million/year • 0.75% additional sales tax • Additional $300 million/year equals $20M/year or .05%. Collection assumed through 2040.
PoP Building Blocks Sales tax rate 37.5% Federal share - LRT .08% 0% State share - PoP capital .14% 0% State share - PoP operation .16% Unfunded CTIB share of PoP .10% 0% RRA share - PoP capital .10% Addn’l. tax needed 12 blocks .58% $232,000,000/yr NOTE: Sales tax rates are estimates and have been rounded.
Other Building Blocks Sales tax rate State $70M bus op. approp. .18% State share of bus expansion Capital .03% Operations.11% State capital & op. share of 9 more arterial BRT (12) .16% Addn’l. tax needed 9+ blocks0.48%. $198,000,000/yr NOTE: Sales tax rates are estimates and have been rounded.
Prioritize • System Expansion/ System Stabilization • Elements • State share – capital, new and existing • State share – operating • RRA share – capital • Commuter rail – No • Bus expansion: regular route & arterial BRT • Federal share • Use of Financing
Next Steps: Program of Projects • Support Governor’s ½-cent increase in transit tax for expansion of transit and stabilization of operations • Continue work with FTA: • MAP-21 includes POP provisions • Policy guidance expected to be issued this summer • Develop scenarios for the POP build out • Back to #1: Get the money!!!!!
Thank You Commissioner Peter McLaughlin, Chair Counties Transit Improvement Board www.mnrides.org peter.mclaughlin@co.hennepin.mn.us