Download
1 / 1
40 likes | 217 Vues
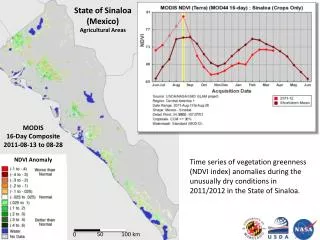
Potential reed canary grass sites (bright pink hue). Other wetlands (dark blue). Mixed agricultural fields. Open water. Residential neighborhood. Golf course. Multitemporal NDVI color composite image

E N D
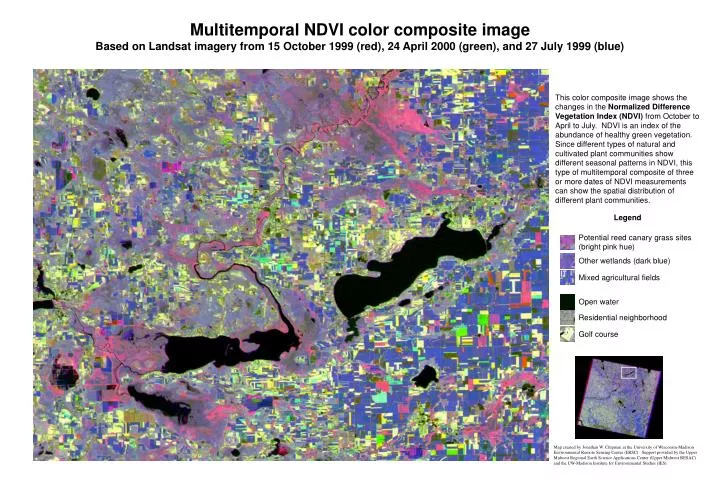
Potential reed canary grass sites (bright pink hue) Other wetlands (dark blue) Mixed agricultural fields Open water Residential neighborhood Golf course Multitemporal NDVI color composite image Based on Landsat imagery from 15 October 1999 (red), 24 April 2000 (green), and 27 July 1999 (blue) This color composite image shows the changes in the Normalized Difference Vegetation Index (NDVI) from October to April to July. NDVI is an index of the abundance of healthy green vegetation. Since different types of natural and cultivated plant communities show different seasonal patterns in NDVI, this type of multitemporal composite of three or more dates of NDVI measurements can show the spatial distribution of different plant communities. Legend Map created by Jonathan W. Chipman at the University of Wisconsin-Madison Environmental Remote Sensing Center (ERSC). Support provided by the Upper Midwest Regional Earth Science Applications Center (Upper Midwest RESAC) and the UW-Madison Institute for Environmental Studies (IES).