html5-img
1 / 17

Congestion Report

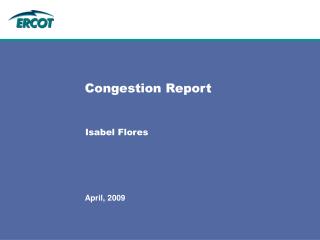
Congestion Report. Isabel Flores. Background . Provide trend of local congestion costs and deployments Costs shown in millions with values provided for June and July OOMC OOM Down LBE Down OOM Up LBE Up RPRS MCPE trend Inter-zonal costs. OOMC 2007 vs. 2008 - $M.

diata
Télécharger la présentation

Congestion Report

An Image/Link below is provided (as is) to download presentation Download Policy: Content on the Website is provided to you AS IS for your information and personal use and may not be sold / licensed / shared on other websites without getting consent from its author. Content is provided to you AS IS for your information and personal use only. Download presentation by click this link. While downloading, if for some reason you are not able to download a presentation, the publisher may have deleted the file from their server. During download, if you can't get a presentation, the file might be deleted by the publisher.

E N D

Presentation Transcript


  1. Congestion Report Isabel Flores WMS

  2. Background • Provide trend of local congestion costs and deployments • Costs shown in millions with values provided for June and July • OOMC • OOM Down • LBE Down • OOM Up • LBE Up • RPRS • MCPE trend • Inter-zonal costs WMS

  3. OOMC 2007 vs. 2008 - $M WMS

  4. OOMC 2007 vs. 2008 – deployments WMS

  5. OOM Down 2007 vs. 2008 - $M WMS

  6. OOM Down 2007 vs. 2008 - deployments WMS

  7. Balancing Energy Down 2007 vs. 2008 - $M WMS

  8. Balancing Energy Down 2007 vs. 2008 - deployments WMS

  9. OOM Up 2007 vs. 2008 - $M WMS

  10. OOM Up 2007 vs. 2008 - deployments WMS

  11. Balancing Energy Up 2007 vs. 2008 - $M WMS

  12. Balancing Energy Up 2007 vs. 2008 - deployments WMS

  13. Local Congestion Costs 2001-2008 WMS

  14. Replacement Reserve WMS

  15. Replacement Reserve WMS

  16. MCPE 2003-2008 WMS

  17. Inter-zonal Congestion Costs 2007-2008 WMS

More Related