Download
1 / 49
590 likes | 1.2k Vues
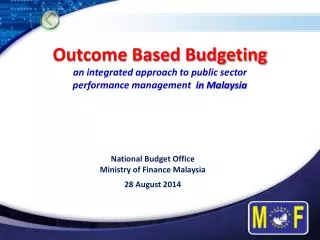
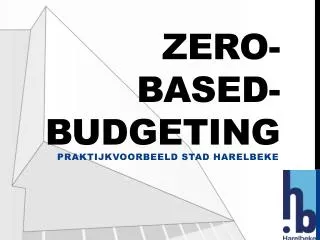
CHAPTER. Functional and Activity-Based Budgeting. Planning. Strategic Plan. Long-Term Objectives. Budgeting, Planning and Control. Short-Term Objectives. Short-Term Plan. Budgets. Feedback. Planning. Control. Strategic Plan. Monitoring of Actual Activity. Long-Term Objectives.

E N D
CHAPTER Functional and Activity-Based Budgeting
Planning Strategic Plan Long-Term Objectives Budgeting, Planning and Control Short-Term Objectives Short-Term Plan Budgets Feedback
Planning Control Strategic Plan Monitoring of Actual Activity Long-Term Objectives Short-Term Objectives Short-Term Plan Comparison of Actual with Planned Budgets Investigation Feedback Corrective Action
Advantages of Budgeting 1. It forces managers to plan. 2. It provides information that can be used to improve decision making. 3. It provides a standard for performance evaluation. 4. It improves communication and coordination.
Master budget adalah rencana keuangan komprehensif bagi organisasi secara keseluruhan. Biasanya, master budget untuk satu tahun, sesuai dengan tahun fiskal perusahaan.
Master budget dapatdibagimenjadianggaranoperasidananggaranfinansial.
Operational Budget mendeskripsikanaktivitas yang menghasilkanpendapatanbagiperusahaan. Operating budgets describe the income-generating activities of a firm.
Financial budgets merincialiranmasukdankeluarkassertaposisikeuangankeseluruhan. Operating budgets describe the income-generating activities of a firm.
Preparing the Operating Budget • Sales budget • Production budget • Direct materials purchases budget • Direct labor budget • Overhead budget • Selling and administrative expenses budget • Ending finished goods inventory budget • Cost of goods sold budget
Schedule 1 Texas Rex, Inc. Sales Budget For the Year Ended December 31, 2004 Quarter 1 2 3 4 Year Units 1,000 1,200 1,500 2,000 5,700 Unit selling price x $10x $10x $10x $10x $10 Budgeted sales $10,000 $12,000 $15,000 $20,000 $57,000
Menghitung Unit yang diproduksi Perkiraan unit penjualan + Unit Persediaan akhir – Unit Persediaan awal Unit diproduksi =
Schedule 2 Texas Rex, Inc. Production Budget For the Year Ended December 31, 2004 Quarter 1 2 3 4 Year Sales (Schedule 1) 1,000 1,200 1,500 2,000 5,700 Persediaan akhir yang diharapkan 240 300 400 200 200 Total Kebutuhan 1,240 1,500 1,900 2,200 5,900 Less: Persediaan awal -180 -240 -300 -400 -180 Units yang diproduksi 1,060 1,260 1,600 1,800 5,720
Perhitungan Unit yang dibeli Pembelian = Kebutuhan Bahan baku + Persediaan akhir bahan baku – Persediaan awal Bahan baku
Schedule 3 Texas Rex, Inc. Direct Materials Purchases Budget For the Year Ended December 31, 2004 Kaos Polos Quarter 1 2 3 4 Year Unit diproduksi (Schedule 2) 1,060 1,260 1,600 1,800 5,720 Bahan baku per unit x 1x 1x 1x 1x 1 Kebutuhan Produksi 1,060 1,260 1,600 1,800 5,720 Persediaan akhir diharapkan 126 160180 106 106 Total kebutuhan 1,186 1,420 1,780 1,906 5,826 Continued
Quarter 1 2 3 4 Year Total Kebutuhan 1,186 1,420 1,780 1,906 5,826 Less: persediaan awal -58 -126 -160 -180 -58 Bahan baku yang dibeli 1,128 1,294 1,620 1,726 5,768 Biaya per unit x $3x $3x $3x $3x $3 Total pembelian kaos polos $3,384 $3,882 $4,860 $5,178 $17,304 Kaos Polos
Schedule 3 Texas Rex, Inc. Direct Materials Purchases Budget For the Year Ended December 31, 2004 Quarter 1 2 3 4 Year Unit diproduksi (Schedule 2) 1,060 1,260 1,600 1,800 5,720 Bahan baku per unit x 5x 5x 5x 5x 5 Kebutuhan Produksi 5,300 6,300 8,000 9,000 28,600 Persediaan akhir diharapkan 630 800900 530 530 Total kebutuhan 5,930 7,100 8,900 9,530 29,130 Continued
Quarter 1 2 3 4 Year Total kebutuhan 5,930 7,100 8,900 9,530 29,130 Less: persediaan awal -390 -630 -800 -900 -390 Bahan baku dibeli 5,540 6,470 8,100 8,630 28,740 Biaya per ons tinta x $0.20x $0.20x $0.20x $0.20x $0.20 Total pembelian tinta $ 1,108$ 1,294$ 1,620$ 1,726$ 5,748 Total biayapembelian bahanbaku $4,492 $5,176 $6,480 $6,904 $23,052
Schedule 4 Texas Rex, Inc. Direct Labor Budget For the Year Ended December 31, 2004 Quarter 1 2 3 4 Year Unit diproduksi (Schedule 2) 1,060 1,260 1,600 1,800 5,720 Tenaga Kerja Lgs per unit (jam) x 0.12x 0.12x 0.12x 0.12x 0.12 Total jam dibutuhkan 127.2 151.2 192 216 686.4 Rata-rata upah per jam x $10x $10x $10x $10x $10 Total Biaya Tenaga kerja langsung $1,272 $1,512 $1,920 $2,160 $6,864
Schedule 5 Texas Rex, Inc. Overhead Budget For the Year Ended December 31, 2004 Quarter 1 2 3 4 Year Jam tenaga kerja lgs dianggarkan 127.2 151.2 192 216 686.4 Tarif overhead Variabel x $5x $5x $5x $5x $5 Overhead variable dianggarkan $ 636 $ 756 $ 960 $1,080 $ 3,432 Overhead tetap dianggarkan 1,645 1,6451,645 1,645 6,580 Total overhead $2,281 $2,401 $2,605 $2,725 $10,012
Units Unit Cost Total Finished goods: Kaos ber-Logo 200 $6.95 $1,390 Schedule 6 Texas Rex, Inc. Ending Finished Goods Inventory Budget For the Year Ended December 31, 2004 Penghitungan biaya per unit: Direct materials ($3 + $1) $4.00 Direct labor (0.12 hr. @ $10) 1.20 Overhead: Variable (0.12 hr. @ $5) 0.60 Fixed (0.12 hr. @ $9.59) 1.15 Total unit cost $6.95
Schedule 7 Texas Rex, Inc. Cost of Goods Sold Budget For the Year Ended December 31, 2004 Direct materials used (Schedule 3) $22,880 Direct labor used (Schedule 4) 6,864 Overhead (Schedule 5) 10,012 Budgeted manufacturing costs $39,756 Beginning finished goods 1,251 Goods available for sale $41,007 Less: Ending finished goods (Sched. 6) - 1,390 Budgeted cost of goods sold $39,617
Schedule 8 Texas Rex, Inc. Selling and Administrative Expenses Budget For the Year Ended December 31, 2004 Quarter 1 2 3 4 Year Planned sales in units (Schedule 1) 1,000 1,200 1,500 2,000 5,700 Variable selling and administrative expenses per unit x $0.10x $0.10x $0.10x $0.10x $0.10 Total variable expenses $ 100$ 120$ 150$ 200$ 570 Continued
Quarter 1 2 3 4 Year Fixed selling and admin- istrative expenses: Salaries $1,420 $1,420 $1,420 $1,420 $5,680 Utilities 50 50 50 50 200 Advertising 100 200 300 500 1,100 Depreciation 150 150 150 150 600 Insurance --- --- 500 --- 500 Total fixed expenses $1,720$1,820$2,420$2,120$8,080 Total selling and admin- istrative expenses $1,820 $1,940 $2,570 $2,320 $8,650
Schedule 9 Texas Rex, Inc. Budgeted Income Statement For the Year Ended December 31, 2004 Sales (Schedule 1) $57,000 Less: Cost of goods sold (Schedule 7) -39,617 Gross margin $17,383 Less: Selling and administrative expenses (Schedule 8) -8,660 Operating income $ 8,733 Less: Interest expense (Schedule 10) - 60 Income before taxes $ 8,673 Less: Income taxes (Schedule 10) -2,550 Net income $ 6,123
Mempersiapkan Financial Budgets • The cash budget • The budgeted balance sheet • The budget for capital expenditures
The Cash Budget Saldo Awal Kas xxx Add: Penerimaan Kas xxx Kas tersedia xxx Less: Pengeluaran Kas xxx Less: saldo Kas Minimum xxx Surplus (defisit) Kas xxx Add: Kas dari pinjaman xxx Less: Pembayaran pinjaman xxx Add: saldo kas minimum xxx Saldo Kas Akhir xxx
$1,000 (loan) - $977 + $1,000 (minimum cash balance) The Cash Budget Texas Rex, Inc. 1st Quarter Beginning cash balance $ 5,200 Add: Cash receipts (cash and credit sales) 10,600 Total cash available 15,800 Less: Cash disbursements -15,777 Less: Minimum cash balance - 1,000 Total cash needs -16,777 Excess or deficiency (-) of cash - 977 Add: Cash from loans 1,000 Less: Loan repayments ---- Ending cash balance $ 1,023
Texas Rex, Inc. Cash Receipts Pattern for 2004 Source Quarter 1 Quarter 2 Quarter 3 Quarter 4 Cash sales $ 2,500 $ 3,000 $ 3,750 $ 5,000 Received on account from: Quarter 4, 2003 1,350 Quarter 1, 2004 6,750 750 Quarter 2, 2004 8,100 900 Quarter 3, 2004 10,125 1,125 Quarter 4, 2004 ---- ---- --- 13,500 Total cash receipts $10,600 $11,850 $14,775 $19,625
Schedule 11 Texas Rex, Inc. Budgeted Balance Sheet December 31, 2004 Assets Current assets: Cash $ 7,503 Accounts receivable 1,500 Materials inventory 424 Finished goods inventory 1,390 Total current assets $10,817 Property, plant, and equipment: Land $ 1,100 Building and equipment 36,500 Accumulated depreciation -7,760 Total property, plant, and equipment 29,840 Total assets $40,657 Continued
Liabilities and Owners’ Equity Current liabilities: Accounts payable $ 1,381 Owners’ equity: Retained earnings $39,276 Total owners’ equity 39,276 Total liabilities and owners’ equity $40,657
Production Budget Direct Materials Purchases Budget Direct Labor Budget Overhead Budget Cash Budget Sales Budget The Master Budget
Sales Budget Production Budget Direct Materials Purchases Budget Direct Labor Budget Overhead Budget Ending FG Inventory Budget (Unit cost) Cash Budget The Master Budget
Sales Budget Production Budget Direct Materials Purchases Budget Direct Labor Budget Overhead Budget Cost of Goods Sold Budget Budgeted IS Ending FG Inventory Budget Selling and Administrative Expenses Budget` The Master Budget Cash Budget
Static Budgets versus Flexible Budgets A static budget adalah anggaran untuk tingkat aktivitas tertentu. A flexible budgetadalah anggaran yang memungkinkan suatu perusahaan untuk menghitung perkiraan biaya dalam suatu tingkat aktivitas.
Performance Report Quarterly Production Costs Actual Budgeted Variance Units produced1,2001,060140 F Direct materials cost $4,830 $4,240 $590 U Direct labor costs 1,440 1,272 168 U Fixed overhead: Variable: Supplies 535 477 58 U Power 170 159 11 U Fixed: Supervision 1,055 1,105 -50 F Depreciation 540 540 --- Total $8,570 $7,793 $777 U
The Uses of Flexible Budget • The flexible budget can be used to prepare the budget before the fact for the expected level of activity. • Flexible budgeting can be used to compute what costs should have been for the actual level of activity. • Flexible budgeting can help managers deal with uncertainty by allowing them to see the expected outcomes for a range of activities.
Flexible Production Budget Range of Production (units) Production Costs 1,000 1,200 1,400 Variable Cost per Unit Variable overhead: Direct materials $4.00 $4,000 $4,800 $5,600 Direct labor 1.20 1,200 1,440 1,680 Variable overhead: Supplies 0.45 450 540 630 Power 0.15 150 180 210 Total variable costs $5.80 $5,800$6,960$8,120 Fixed overhead: Supervision $1,105 $1,105 $1,105 Depreciation 540 540 540 Total fixed costs $1,645$1,645$1,645 Total production costs $7,445 $8,605 $9,765
Performance Report Quarterly Production Costs Actual Budget Variance Units produced1,200 1, 200 ---- Direct materials $4,830 $4,800 $30 U Direct labor 1,440 1, 440 ---- Variable overhead: Supplies 535 540 -5 F Power 170 180-10 F Total variable costs $6,975$6,960$15 F Continued
Performance Report Quarterly Production Costs Actual Budget Variance Units produced1,200 1, 200 ---- Fixed overhead: Supervision 1,055 1,105 -50 F Depreciation 540 540 --- Total fixed costs $1,595 $1,645-$50 F Total production costs $8,570 $8,605 $35 U
Behavior Dimensions of Budgeting • Goal congruence • Dysfunctional behavior • Frequent feedback on performance • Monetary and nonmonetary incentives • Participative budgeting • Realistic standards • Controllability of costs • Multiple measures of performance
Participative budgeting has three potential problems: • Setting standards that are either too high or too low. • Building slack into the budget. • Pseudoparticipation.
Activity-Based Budgeting Activity flexible budgeting is the prediction of what activity costs will be as activity output changes.
Flexible Budget: Direct Labor Hours Cost Formula Direct Labor Hours Direct materials --- $10 $100,000 $200,000 Direct labor --- 8 80,000 160,000 Maintenance $ 20,000 3 50,000 80,000 Machining 15,000 1 25,000 35,000 Inspections 120,000 --- 120,000 120,000 Setups 50,000 --- 50,000 50,000 Purchasing 220,000 --- 220,000 220,000 Total $425,000 $22 $645,000 $865,000 Fixed Variable 10,000 20,000
Activity Flexible Budget Driver: Direct Labor Hours Formula Level of Activity Direct materials --- $10 $100,000 $200,000 Direct labor --- 8 80,000 160,000 Subtotal $0$18$180,000$360,000 Driver: Machine Hours Maintenance $20,000 $5.50 $64,000 $108,000 Machining 15,000 2.00 31,000 47,000 Subtotal $35,000$7.50$95,000$155,000 Fixed Variable 10,000 20,000 Fixed Variable 8,000 16,000 Continued
Activity Flexible Budget Driver: Number of Setups Fixed Variable 25 30 Inspections $80,000 $2,100 $132,500 $143,000 Setups --- 1,800 45,000 54,000 Subtotal $80,000$3,900$177,500$197,000 Driver: Number of Orders Fixed Variable 15,000 25,000 Purchasing $211,000$ 1$226,000$236,000 Total $678,500 $948,000
Activity-Based Performance Report Actual CostsBudgeted CostsBudget Variance Direct materials $101,000 $100,000 $ 1,000 U Direct labor 80,000 80,000 --- Maintenance 55,000 64,000 9,000 F Machining 29,000 31,000 2,000 F Inspections 125,500 132,500 7,000 F Setups 46,500 45,000 1,500 U Purchasing 220,000226,000 6,000 F Total $657,000 $678,500 $21,500 F
Variances for the Inspection Activity Activity Actual Cost Budgeted Cost Variance Inspection: Fixed $ 82,000 $ 80,000 $2,000 U Variable 43,500 52,500 9,000 F Total $125,500 $132,500 $7,000 F
Chapter Eight The End