Download
1 / 52
540 likes | 858 Vues
Activity-Based Costing and Other Cost Management Tools. Chapter 5. Objective 1. Develop departmental overhead rates and activity-based costs (ABC). Activity-Based Costing. A way to allocate indirect cost to production Focus – on activities and cost of activities

E N D
Activity-Based Costingand Other CostManagement Tools Chapter 5
Objective 1 Develop departmental overhead rates and activity-based costs (ABC)
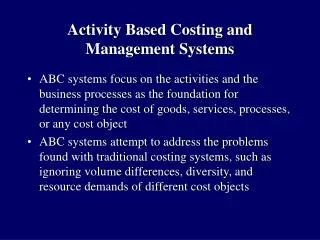
Activity-Based Costing • A way to allocate indirect cost to production • Focus – on activities and cost of activities • Each activity has its own cost driver • Uses a separate allocation rate for each activity
Activity-Based Costing Steps: • Identify the activities • Estimate the total indirect costs of each activity • Identify the allocation base for each activity’s indirect costs (the primary cost driver) • Estimate the total quantity of each allocation base
Activity-Based Costing Steps: • Compute cost allocation rate for each activity(Estimated total indirect costs of activity ÷Estimated total quantity of cost allocation base) • Obtain actual quantity of each allocation base used by the cost object • Allocate indirect costs to cost object
E5-16 Steps: 1. Identify each activity • Material handling • Machine setup • Insertion of parts • Finishing 2. Estimate the total indirect costs of each activity $12,000 3,400 48,000 80,000
E5-16 Steps: 3. Identify the allocation base for each activity’s indirect costs (the primary cost driver)
E5-16 Steps: 4. Estimate the total quantity of each allocation base
E5-16 Steps: 5. Compute cost allocation rate for each activity
E5-16 6. Obtain actual quantity of each allocation base used by the cost object – 1,000 wheels 7. Allocate indirect costs to cost object Average quantities of cost allocation bases used per fender: Parts: 3,000 ÷ 1,000 = 3 Setups: 10 ÷ 1,000 = 0.01 Finishing direct labor hrs: 2,000 ÷ 1,000 = 2
E5-17 Budgeted total indirect overhead cost $461,500 Budgeted direct labor hrs 5,000 Single allocation rate per $461,500direct labor hr 5,000 = $92.30
E5-17 Indirect manufacturing cost per wheel: Standard model: 2 $92.30 = $184.60 Deluxe model: 3 $92.30 = $276.90
Objective 2 Use activity-based management (ABM) to make business decisions
Decisions • Pricing and product mix • Cutting costs • Value engineering – reevaluating activities to reduce costs while satisfying customer needs • Routine Planning and Control Decisions • Create budgets • Evaluate workers
ABC in Merchandising and Service Companies • Allocate period costs among product or service lines
E5-18 Enke Company ABC Data Gross Profits Standard Deluxe Sale price $300.00 $440.00 Direct materials 30.00 46.00 Direct labor 45.00 50.00 Indirect overhead 165.50 296.00 Gross profit $59.50 $48
E5-18 Enke Company ABC Data Gross Profits Standard Deluxe Sale price $300.00 $440.00 Direct materials 30.00 46.00 Direct labor 45.00 50.00 Indirect overhead 184.60 276.90 Gross profit $40.40 $67.10
E5-18 Finishing activity cost per rim: 2.0 hrs per rim x $40 per hour = $80 per rim
E5-18 New cost of deluxe rim: Direct materials $46.00 Direct labor 50.00 Indirect costs: Materials handling 22.50 Machine setups 4.50 Insertion parts 144.00 Finishing 80.00 Total $347.00
Objective 3 Decide when ABC is most likely to pass the cost-benefit test
Cost-Benefit Test • When the benefits of adopting ABC/ABM exceed the costs
E5-19 Indications that ABC might pass the cost-benefit test • Enke produces two different products that use different amounts of the company's resources. • Indirect manufacturing costs are a large portion of total costs.
E5-19 • Enke hired a new controller who should have the accounting expertise to develop an ABC system. • Enke recently purchased bar coding information technology, which reduces the cost to keep track of allocation bases such as the number of parts.
E5-19 Warning signs that Enke's old cost system was "broken”: • Managers cannot explain profits—despite switching to what should have been a more profitable product mix, profits were declining. • Enke was using a direct-labor-based single allocation rate system developed 20 years ago.
E5-19 • Enke reengineered its production process but it had not changed its accounting system (until Babin developed the new ABC system).
Objective 4 Describe a just-in-time (JIT) production system, and record its manufacturing costs
Just-in-Time Systems Receive order from customer Schedule production Defect-free materials are delivered by suppliers just in time for production Finished product is delivered to customer
Just-in-Time Systems shaping smoothing cutting Finished Goods grinding
Just-in-Time • Production activities in self-contained cells • Short setup times • Broad employee roles • Small batches produced just in time • Shortened manufacturing cycle times • Emphasis on quality • Supply-chain management
Just-in-Time Costing • “Backlash costing” – records cost of production when units are completed • Inventory accounts – only two • Raw and In-Process Inventory • Finished Goods Inventory • Manufacturing costs – only two • Direct materials • Conversion costs
Exercise 5-22 • (in millions) • Raw & In Process Inventory 6,500 • Accounts Payable 6,500 • Conversion Costs 7,420 • Various accounts 7,420
Exercise 5-22 • Finished Goods Inventory 11,200 • Raw and In Process Inventory (200x$24) 4,800 • Conversion Costs(200x$32) 6,400 • Cost of Goods Sold ($196x56) 10,976 • Finished Goods Inventory 10,976
Exercise 5-22 Conversion Costs 7,420 6,400 Bal. 1,020 • Cost of Goods Sold 1,020 • Conversion Costs 1,020
Exercise 5-22 Finished Goods Inventory Beg bal 100 10,976 Goods sold Goods completed 11,200 Bal. 324
Objective 5 Contrast the four types of quality costs and use them to make decisions
Total Quality Management Goals • To provide customers with superior products and services • Continuous improvement • Improve quality • Eliminate defects and waste
Types of Quality Costs • Prevention costs – avoid poor quality goods or services • Employee training • Improved materials • Preventive maintenance
Types of Quality Costs • Appraisal costs – detect poor quality goods or services • Inspection throughout production • Inspection of final product • Product testing
Types of Quality Costs • Internal failure costs – avoid poor quality goods or services before delivery to customers • Production loss caused by downtime • Rejected product units
Types of Quality Costs • External failure costs – when poor quality products are delivered to customers and company has to make things right with customer • Lost profits from lost customers • Warranty costs • Service costs at customer sites • Sales returns due to quality problems
E5-24 Prevention costs: • Training employees in TQM • Training suppliers in TQM • Identifying preferred suppliers who commit to on-time delivery of perfect quality materials
E5-24 Appraisal costs: • Strength testing one item from each batch of panels • Avoid inspection of raw materials Internal failure costs: • Avoid rework and spoilage
E5-24 External failure costs: • Avoid lost profits from lost sales due to disappointed customers • Avoid warranty costs