Download
1 / 2
20 likes | 142 Vues
East End Neighborhood House Comparison of 2006 and 2005 Revenue. 2005 Revenue Direct and Indirect Support 5.6% Fees and Grants 87.9% Other Income (Program Fees, Rent, Investment Income, Other Income) 6.5% 2006 Revenue Direct and Indirect Support 2.1%

E N D
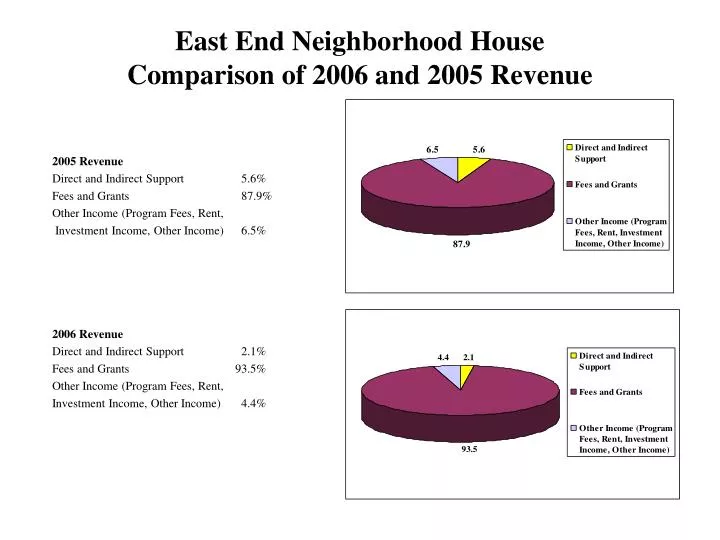
East End Neighborhood HouseComparison of 2006 and 2005 Revenue 2005 Revenue Direct and Indirect Support 5.6% Fees and Grants 87.9% Other Income (Program Fees, Rent, Investment Income, Other Income) 6.5% 2006 Revenue Direct and Indirect Support 2.1% Fees and Grants 93.5% Other Income (Program Fees, Rent, Investment Income, Other Income) 4.4%
East End Neighborhood HouseComparison of 2006 and 2005 Expenses 2005 Expenses Salaries and Fringe Benefits 45.6% Professional & Contract Fees 14.8% Food Provisions 6.7% Occupancy 9.8% Transportation 5.1% Other 18.0% 2006 Expenses Salaries and Fringe Benefits 47.4% Professional & Contract Fees 13.9% Food Provisions 8.1% Occupancy 8.9% Transportation 5.2% Other 16.5%