Download
1 / 12
120 likes | 291 Vues
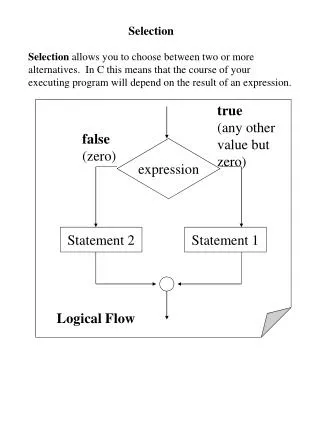
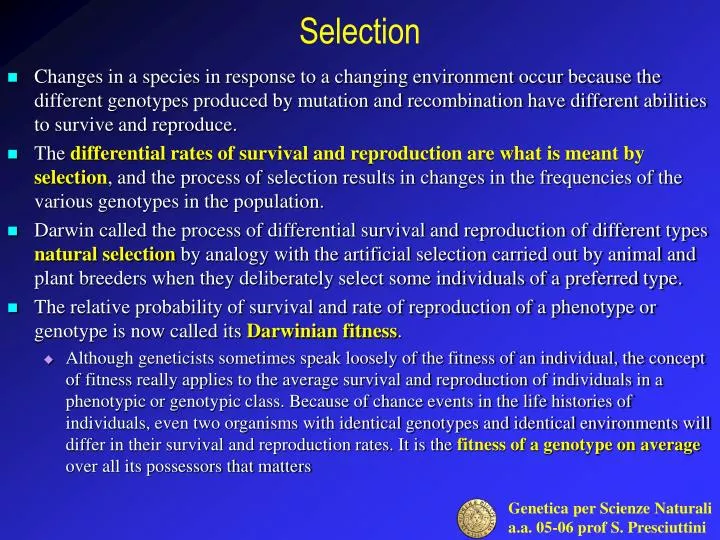
Selection. Changes in a species in response to a changing environment occur because the different genotypes produced by mutation and recombination have different abilities to survive and reproduce.

E N D
Selection • Changes in a species in response to a changing environment occur because the different genotypes produced by mutation and recombination have different abilities to survive and reproduce. • The differential rates of survival and reproduction are what is meant by selection, and the process of selection results in changes in the frequencies of the various genotypes in the population. • Darwin called the process of differential survival and reproduction of different types natural selection by analogy with the artificial selection carried out by animal and plant breeders when they deliberately select some individuals of a preferred type. • The relative probability of survival and rate of reproduction of a phenotype or genotype is now called its Darwinian fitness. • Although geneticists sometimes speak loosely of the fitness of an individual, the concept of fitness really applies to the average survival and reproduction of individuals in a phenotypic or genotypic class. Because of chance events in the life histories of individuals, even two organisms with identical genotypes and identical environments will differ in their survival and reproduction rates. It is the fitness of a genotype on average over all its possessors that matters
How selection works • The simplest way to see the effect of selection is to consider an allele, a, that is completely lethal before reproductive age in homozygous condition. • Suppose that, in some generation, the allele frequency of this gene is 0.10. Then, in a randommating population, the proportions of the three genotypes after fertilization are. • How are these genotype frequencies connected to the allele frequency of 0.1? • The answer is provided by the law of Hardy-Weinberg, which is the way an elementary statistical principle is named in population genetics
Hardy-Weinberg Equilibrium • If the frequency of allele A is p in both the sperm and the eggs and the frequency of allele a is q = 1-p, then the consequences of random unions of sperm and eggs may be worked out in a Punnett square. The Hardy-Weinberg equilibrium frequencies that result from random mating. The frequencies of A and a among both eggs and sperm are p and q ( = 1-p), respectively. The total frequencies of the zygote genotypes are p2 for A/A, 2pq for A/a, and q2 for a/a. The frequency of the allele A in the zygotes is the frequency of A/A plus half the frequency of A/a, or p2 + pq = p(p + q) = p. • The probability that both the sperm and the egg will carry A is p × p = p2, so p2 will be the frequency of A/A homozygotes in the next generation. In like manner, the chance of heterozygotes A/a will be (p × q) + (q × p) = 2pq, and the chance of homozygotes a/a will be q × q = q2. The three genotypes, after a generation of random mating, will be in the frequencies p2:2pq:q2. • In the next generation, the frequencies of the three genotypes will again be p2:2pq:q2, and so forth, forever.
How selection works • Going back to our example of a recessive letal gene with frequency of 0.1, we have the genotype frequencies among newborns of • At reproductive age, however, the homozygotes a/a will have already died, leaving the genotypes at this stage as • But these proportions add up to only 0.99 because only 99 percent of the population is still surviving. Among the actual surviving reproducing population, the proportions must be recalculated by dividing by 0.99 so that the total proportions add up to 1.00. After this readjustment, we have • The frequency of the lethal a allele among the gametes produced by these survivors is then • and the change in allelic frequency in one generation, expressed as the new value minus the old one, has been 0.091- 0.100 = 0.019. We can repeat this calculation in each successive generation to obtain the predicted frequencies of the lethal and normal alleles in a succession of future generations
Fitness and selection • We may take the phenotype with highest absolute fitness, whose overall expectation of progeny that reach reproductive age is maximum),Wmax, as the standard phenotype, with which the fitnesses Wjof other phenotypes can be compared. • Thus, the relative fitness wjof phenotype j is wj =Wj/Wmaxand it can assume any value included between 0 and 1. • We define the selection coefficient or selective disadvantage of phenotypej to besj = 1 – wj. Sometimes it is easier to reason in terms of fitness (w), sometimes it is easier in terms of selection coefficient (s). • A letal phenotype has fitness 0 and the selection coefficient against it is 1.
Change of allele frequency in one generation • We can now consider the example of a deleterious recessive gene in general terms. Multiplying the initial frequency by the fitness of each genotype we obtain the contribution of each genotype to the gametes that will form the next generation: Genotypes AA Aa aa Total Frequency before selection p2 2pq q2 1,00 Fitness 1 1 1-s Frequency after selection p2 2pq q2 (1-s) 1-sq2 • To find the frequency of a genes in the progeny, we can apply the calculation already seen, from which we arrive at the following general formula for the change of the allele frequency in one generation : sq2(1-q) Dq = - 1 – sq2 • We will use this equation to obtain the number of generations of selection needed to reach a specific change of gene frequency. An aswer to this question is sometimes required in connexion with breeding programmes or proposed eugenic measures. We will consider, for simplicity, the special case of s = 1 (complete selection against aa).
Number of generations required • By working with the recursive equation for Dq, we may easily arrive at the result qt = q0/(1+tq0), from which we obtain t = 1/qt – 1/q0. • Consider albinism as an example, and ask the question: how long it take to reduce its frequency to half its present value if albinos are prevented from reproduction ? The present frequency is about 1/20,000, and this makes q0 = 1/141 (q2 = 1/20,000, so q = q2, from the Hardy-Weinberg law). The objective is q2 = 1/40,000, which makes qt = 1/200. So, from the above equation t = 200 – 141 = 59 generations. With 25 years to a generation it would take nearly 1,500 years to achieve this modest result. • A general conclusion from the above example is that it is extremely difficult to significantly reduce the frequency of an allele that is already rare in a population. Thus, eugenic programs designed to eliminate deleterious recessive genes from human populations by preventing the reproduction of affected persons do not work. Of course, if all heterozygotes could be prevented from reproducing, the gene could be eliminated (except for new mutations) in a single generation. Because every human being is heterozygous for a number of different deleterious genes, however, no one would be allowed to reproduce.
Selection in complex situations • A case that illustrates a more complex relation of fitness to environment is sickle-cell anemia. An allelic substitution at the structural-gene locus for the b chain of hemoglobin results in substitution of valine for the normal glutamic acid at chain position 6. The abnormal hemoglobin crystallizes at low oxygen pressure, and the red cells deform and hemolyze. • Homozygotes HbS/HbS have a severe anemia, and survivorship is low. • Heterozygotes have a mild anemia and under ordinary circumstances exhibit the same or only slightly lower fitness than normal homozygotes HbA/HbA. • However, in regions of Africa with a high incidence of malaria (Plasmodium falciparum), heterozygotes (HbA/HbS) have a higher fitness than normal homozygotes because the presence of some sickling hemoglobin apparently protects them from the malaria. Where malaria is absent, the fitness advantage of heterozygosity is lost
Testing Hardy-Weiberg equilibrium for HbA/S • In the course of a survey conducted in an African hospital, 1000 newborn children were typed for hemoglobin A and S, and the following genotype counts were obtained: 778 AA, 205 AS, and 17 SS. Are these frequencies in H-W equilibrium? • The answer is: “Yes, they are; there is no evidence of significant deviation of the observed frequecies from those expected under the H-W law”
HWE in an adult population • Deviation from HWE is now striking. What is going on? Genotype frequencies are in HW proportion at birth, whereas a large excess of heterozygotes is observed among adults. • We may hypothesize that homozygote deficiency is due to selection. Increased mortality of SS homozygotes from severe anemia is obvious; less obvious is an increased mortality of AA homozygotes. • It has been proven both by direct observation and by experiments that mortality from malaria is higher among AA than among AS. • In another survey (Edington, 1957) a large sample of the Yoruba adult population from Ibadan (Nigeria) was typed for hemoglobin A and S, with the following results:
Hetrozygote advantage • We now proceed to estimate the selection coefficients against the two homozygotes • These estimates are based on higly simplified assumptions; nevertheless, they are remarkably close to the values required to explain this polymorphism. • In fact, if the fitness of the heterozygote is higher than that of both homozygotes, the polymorphism is stable. Selection cause the relative frequencies of alleles to rise or fall until they reach equilibrium with both alleles represented at high frequency in the population. • A polymorphism such as HbA/HbS, that is maintained by selection in favor of heterozygotes, is called a balanced polymorphism.
Equilibrium allele frequencies for balanced polymorphisms pq(tq-sp) Dq = 1 – tp2 -sq2 s peq= (t + s) t qeq= (t + s) • We can now work out the equilibrium allele frequency of a balanced polymorphism: Genotypes AA AS SS Total Frequency before selection p2 2pq q2 1,00 Fitness 1-t 1 1-s Frequency after selection p2(1-t) 2pq q2(1-s) 1 - tp2 - sq2 • After selection, the new frequency of allele HbS is therefore: q2 (1-s) + pq q’ = 1-tp2 - sq2 , from which • Equilibrium occurs at Dq = 0, or (tp-sq)=0, from which we find: and • The fact that the values estimated for these selections coefficients are roughly similar to those measured for the real genotypes in areas where malaria is endemic means that the observed allele frequencies may be near their equilibrium values.