Download
1 / 1
10 likes | 136 Vues
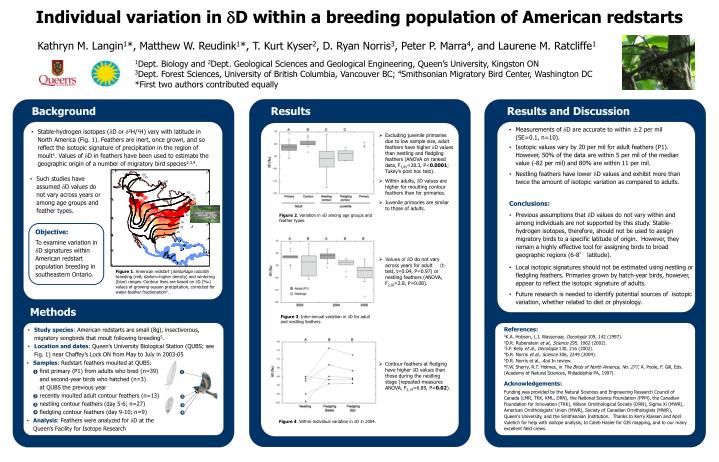
1. 1. 2. 2. 3. 4. 4. 3. Individual variation in D within a breeding population of American redstarts. Kathryn M. Langin 1 *, Matthew W. Reudink 1 *, T. Kurt Kyser 2 , D. Ryan Norris 3 , Peter P. Marra 4 , and Laurene M. Ratcliffe 1.

E N D
1 1 2 2 3 4 4 3 Individual variation in D within a breeding population of American redstarts Kathryn M. Langin1*, Matthew W. Reudink1*, T. Kurt Kyser2, D. Ryan Norris3, Peter P. Marra4, and Laurene M. Ratcliffe1 1Dept. Biology and 2Dept. Geological Sciences and Geological Engineering, Queen’s University, Kingston ON 3Dept. Forest Sciences, University of British Columbia, Vancouver BC; 4Smithsonian Migratory Bird Center, Washington DC *First two authors contributed equally Background Results Results and Discussion • Measurements of D are accurate to within ±2 per mil (SE=0.1, n=10). • Isotopic values vary by 20 per mil for adult feathers (P1). However, 50% of the data are within 5 per mil of the median value (-82 per mil) and 80% are within 11 per mil. • Nestling feathers have lower D values and exhibit more than twice the amount of isotopic variation as compared to adults. • Stable-hydrogen isotopes (D or 2H/1H) vary with latitude in North America (Fig. 1). Feathers are inert, once grown, and so reflect the isotopic signature of precipitation in the region of moult1. Values of D in feathers have been used to estimate the geographic origin of a number of migratory bird species2,3,4. • Excluding juvenile primaries due to low sample size, adult feathers have higher D values than nestling and fledgling feathers (ANOVA on ranked data, F3,85=28.3, P<0.0001; Tukey’s post hoc test). • Within adults, D values are higher for moulting contour feathers than for primaries. • Juvenile primaries are similar to those of adults. • Such studies have assumed D values do not vary across years or among age groups and feather types. Conclusions: • Previous assumptions that D values do not vary within and among individuals are not supported by this study. Stable-hydrogen isotopes, therefore, should not be used to assign migratory birds to a specific latitude of origin. However, they remain a highly effective tool for assigning birds to broad geographic regions (6-8° latitude). • Local isotopic signatures should not be estimated using nestling or fledgling feathers. Primaries grown by hatch-year birds, however, appear to reflect the isotopic signature of adults. • Future research is needed to identify potential sources of isotopic variation, whether related to diet or physiology. Figure 2. Variation in D among age groups and feather types. Objective: To examine variation in D signatures within American redstart population breeding in southeastern Ontario. • Values of D do not vary across years for adult (t-test, t=0.04, P=0.97) or nestling feathers (ANOVA, F2,26=2.8, P=0.08). Figure 1. American redstart (Setophaga ruticilla) breeding (red; darker=higher density) and wintering (blue) ranges. Contour lines are based on D (‰) values of growing-season precipitation, corrected for water-feather fractionation5. Methods Figure 3. Inter-annual variation in D for adult and nestling feathers. • Study species: American redstarts are small (8g), insectivorous, migratory songbirds that moult following breeding5. • Location and dates: Queen’s University Biological Station (QUBS; see Fig. 1) near Chaffey’s Lock ON from May to July in 2003-05 References: 1K.A. Hobson, L.I. Wassenaar, Oecologia 109, 142 (1997). 2D.R. Rubenstein et al., Science 295, 1062 (2002). 3J.F. Kelly et al., Oecologia 130, 216 (2002). 4D.R. Norris et al., Science 306, 2249 (2004). 5D.R. Norris et al., Auk In review. 6T.W. Sherry, R.T. Holmes, in The Birds of North America, No. 277, A. Poole, F. Gill, Eds. (Academy of Natural Sciences, Philadelphia PA, 1997). Acknowledgements: Funding was provided by the Natural Sciences and Engineering Research Council of Canada (LMR, TKK, KML, DRN), the National Science Foundation (PPM), the Canadian Foundation for Innovation (TKK), Wilson Ornithological Society (DRN), Sigma Xi (MWR), American Ornithologists’ Union (MWR), Society of Canadian Ornithologists (MWR), Queen’s University, and the Smithsonian Institution. Thanks to Kerry Klassen and April Vuletich for help with isotope analysis, to Caleb Hasler for GIS mapping, and to our many excellent field crews. • Study species: American redstarts are small (8g), insectivorous songbirds that molt following breeding5. • Location and dates: Queen’s University Biological Station (QUBS; see Fig. 1) from May to July in 2003-05 • Samples: Redstart feathers moulted at QUBS: • first primary (P1) from adults who bred (n=39) and second-year birds who hatched (n=3) at QUBS the previous year • recently moulted adult contour feathers (n=13) nestling contour feathers (day 5-6; n=27) fledgling contour feathers (day 9-10; n=9) • Analysis: Feathers were analyzed for D at the Queen’s Facility for Isotope Research • Contour feathers at fledging have higher D values than those during the nestling stage (repeated-measures ANOVA, F2,14=6.89, P=0.02). Figure 4. Within-individual variation in D in 2004.