Download
1 / 21
210 likes | 349 Vues
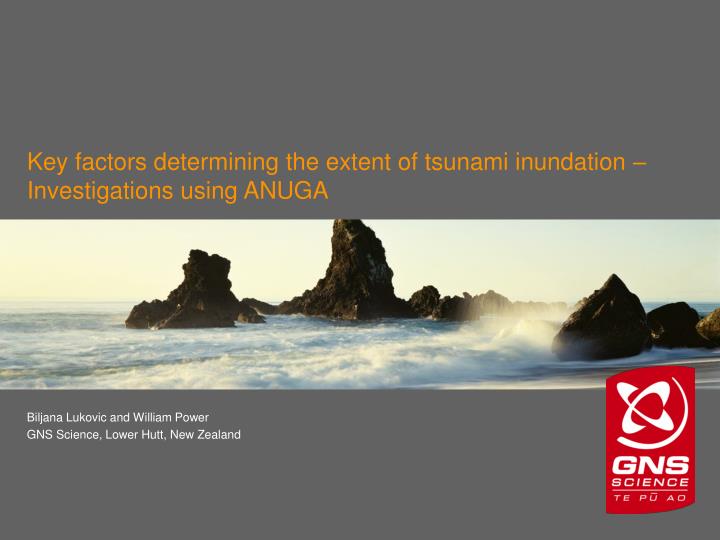
Key factors determining the extent of tsunami inundation – Investigations using ANUGA. Biljana Lukovic and William Power GNS Science, Lower Hutt, New Zealand. Introduction. Estimating the extent of tsunami inundation is necessary for assessing tsunami risk

E N D
Key factors determining the extent of tsunami inundation – Investigations using ANUGA Biljana Lukovic and William Power GNS Science, Lower Hutt, New Zealand
Introduction • Estimating the extent of tsunami inundation is necessary for assessing tsunami risk • The propagation and inundation of a tsunami are often modelled separately • ANUGA used to model tsunami inundation • Determine the key factors that affect the inundation extent • Synthetic boundary conditions applied that allow variation of different parameters • Realistic site model generated from real topography, bathymetry and roughness • Plan to apply this technique to a variety of coastal terrains
Site model • Christchurch area was chosen as our first example • Relatively uniform offshore slope • Coastal dunes stretch north from a tidal estuary • Flat alluvial plains behind the estuary and the dunes • Steep slopes on volcanic hills to the south of the estuary
Initial conditions • LIDAR data used to create elevation layer • Bathymetry digitised from marine navigation charts • Land use data from 1:50K topographic maps used to create friction layer • All layers converted to 25 m spaced grid points for input to ANUGA
Model boundary conditions • Boundary conditions used • Front: time-dependent • Side: reflective • Back: transmissive • Front boundary aligned to 10 m bathymetry contour • For the Time Dependent boundary we used the Time_boundary() function with zero currents and twice the desired amplitude. • We encountered problems using Transmissive_Momentum_Set_Stage_boundary() Reflective Transmissive Time dependent Transmissive Reflective Transmissive
Sensitivity testing We adopted standard model parameters to define the time dependent boundary conditions: • sinusoidal wave shape • 15 minute wave period • 3 m amplitude (the amplitude passed to the Time_boundary() function is twice this) • 3 consecutive waves • model runs for another 60 min after the last wave leaves the boundary
Sensitivity testing • We varied one of the following parameters at a time, while keeping the other parameters the same as in our standard model • Wave shape • Wave period • Number of consecutive waves • Wave amplitude • We compared the results in terms of • distribution of water • area inundated • water depth along the coast
Standard model - results Sand dunes Estuary entrance Steep slopes Valley • Maximum water height at the coast is just south of the estuary mouth where the coast is backed by steep slopes • Minimum heights occur just north of the estuary and to the south where the coast is backed by a flat valley • Water heights show variation along part of the coast backed by dunes • Water height changes over short distances are related to the size of triangular mesh and disappear when a finer mesh is used
Wave shape • Sinusoidal wave shape (recession first) water height = tide - A * sin (t * 2 * π/ λ) • Sawtooth wave shape (recession first) • used to represent waves with almost vertical front water height = tide + A – 2 * A * fmod (t + λ / 2, λ) / λ A - doubled amplitude (m) t - time λ – wave period
Wave shape • Sinusoidal wave inundates a larger area than the sawtooth wave • Sawtooth wave produces deeper inundation on and near the coastal sand dunes • At the coast the water heights produced by the sawtooth wave were higher in some locations north of the estuary, but much lower at the estuary entrance and to the south Difference between inundation depths generated by sawtooth and sinusoidal wave (m) Sinusoidal Sawtooth
Wave shape • Sinusoidal wave inundates a larger area than the sawtooth wave • Sawtooth wave produces deeper inundation on and near the coastal sand dunes • At the coast the water heights produced by the sawtooth wave were higher in some locations north of the estuary, but much lower at the estuary entrance and to the south
Number of consecutive waves • The model was run for 1, 2, 3, 4 and 5 consecutive waves • The inundated area increases with the number of consecutive waves • The water heights along the coast follow the same trend when the number of consecutive waves is changed • The water height along the coast slightly increases with the number of waves • The largest increase (of around 20 cm) is between the 1 and 2 wave models 1 2 5 3 4
Wave period • The model was run for 5 wave periods: 5, 10, 15, 20 and 25 min • The area inundated increases with increasing wave period • The distribution of water heights along the coast changes significantly when the wave period changes • The highest water height at the coast is generated by the 10 min period wave and is located at the part of the coast backed by sand dunes • The water heights at the coast start decreasing with further increase of wave period 5 10 15 20 25
Wave amplitude • The model was run for 3 amplitudes: 2, 3 and 4 m • The inundated area increases significantly with increasing amplitude • The water heights at the coast increase significantly with increasing amplitude, and they follow the same trend along the coast 2 4 3
Problems encountered when modelling • Sometimes ANUGA halts with an error message “small time step” • Usually occurs with large numbers of consecutive waves and large amplitudes • Work-around is to tweak the domain boundaries (thus creating a new mesh) • Elevation output does not replicate input elevation data • Substantial differences in areas of high slope, but unlikely to affect inundation • Differences of up to 3 m in inundated areas – may affect risk modelling? • Possible solution, use smaller triangles and more closely spaced input data?
Problems encountered when modelling • Sometimes ANUGA halts with an error message “small time step” • Usually occurs with large numbers of consecutive waves and large amplitudes • Work-around is to tweak the domain boundaries (thus creating a new mesh) • Elevation output does not replicate input elevation data • Substantial differences in areas of high slope, but unlikely to affect inundation • Differences of up to 3 m in inundated areas – may affect risk modelling? • Possible solution, use smaller triangles and more closely spaced input data? • Inundated areas detached from the sea and negative water elevation • Artefacts created in areas with ground elevation below zero
Conclusions • ANUGA is a very flexible tool for studying tsunami inundation • Arbitrary boundary shapes • Various boundary conditions available • Variable triangle density • Convenient Python scripting • In addition to wave amplitude, we also find that wave period and the number of waves are important factors influencing the extent of inundation in areas where a tsunami overtops coastal dunes (or other barriers). • A steep fronted wave may cause higher run-up and water depths on slopes close to the coast, but the total area of inundation was less in our model.