Download

1 / 15
200 likes | 467 Vues
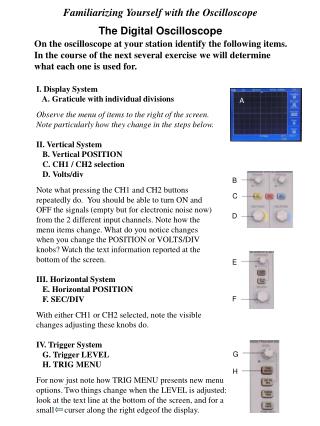
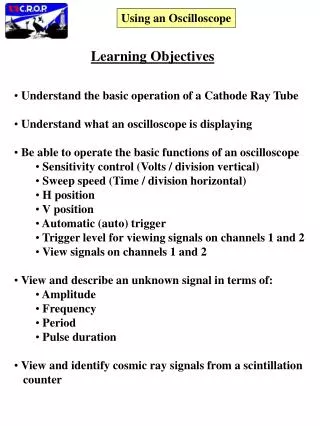
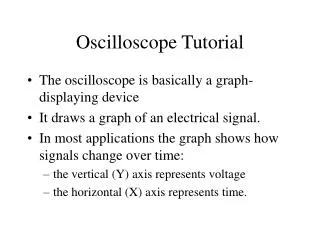
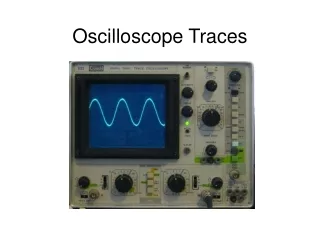
THE OSCILLOSCOPE. Introduction. The oscilloscope displays a waveform, which is a plot of voltage (vertically) versus time (horizontally). The waveform can be oscillating, rising or falling. For an oscillating waveform, the vertical height (voltage) and period (time) can be easily identified.

E N D
Introduction • The oscilloscope displays a waveform, which is a plot of voltage (vertically) versus time (horizontally). • The waveform can be oscillating, rising or falling. • For an oscillating waveform, the vertical height (voltage) and period (time) can be easily identified.
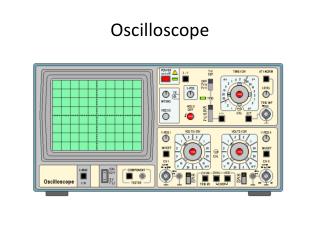
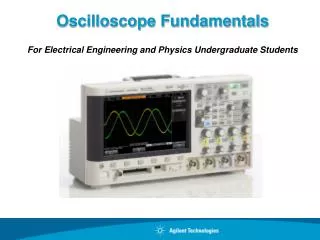
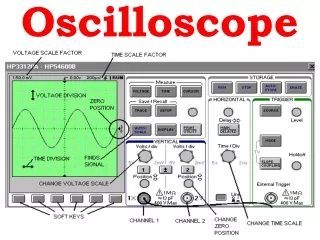
Trigger Controls The intensity control changes the brightness of the wave. The focus control changes the sharpness of the wave. Vertical controls measuring voltage. Two channels. Horizontal controls measuring time. Power Button Sections of the Oscilloscope
These knobs place the trace in a particular spot on the screen. One knob for each channel. These knobs are multipliers that allow the trace to be seen and measured on the screen. One knob for channel one and one for channel two. These knobs place the trace in a particular spot on the screen. One knob for each channel. These knobs place the trace in a particular spot on the screen. One knob for each channel. Mode selects what is displayed on the screen. Channel one, Channel two, both channels, or both channels added together can be displayed. Vertical and Voltage Controls
Horizontal and Time Controls Position: Moves the location of the wave horizontally on the screen. This knob is a multiplier that allows the trace to be seen and measured on the screen.
Triggering Triggering allows the waveform to appear stationary on the screen. Current is continually flowing in a circuit. In order to read a wave on the oscilloscope the wave needs to be triggered with a source that causes the wave to appear not to be moving. When an oscilloscope is triggered a start point is initiated as a reference point from which the wave will be measured. Without a trigger the wave will appear as many waves offset slightly from one another. An external source can also be used to trigger a signal. To do this, use one of the probes connected to the source you wish to use as a trigger. The best way to trigger a waveform is to use channel 1.
Measuring a signal accurately with any type of probe is difficult because of circuit loading. Circuit loading is an inaccuracy caused by the interaction of the probe with the oscilloscope. To prevent this interaction, an attenuator is built into the probe. This probe can be switched from 10x to 1x. 1x for weak signals. When using 10x, the amplitude is reduced by a factor of 10, but the reading will be more accurate. The Probe Probe clip connects to the location in the circuit you wish to measure. Alligator clip connects to ground.
Obtaining A Wave The Goal: Obtain 2-4 complete waves on the screen. Helpful Hints: • Calculate the theoretical wave form and set controls to show the wave you should see on the screen. • Know the controls. Have an experienced person set up a known waveform. Then adjust the controls one at a time and observe how they affect the wave. • If Step 1 does not work, try setting the controls at their midpoint.
Measuring Frequency • Position the wave on the scope. • Determine the start of the wave and the end of the wave. • Read the number of divisions. • Multiply by the time base. • Calculate the frequency.
End of the wave Start of the wave. 2.2 Div Read Number of Divisions
Multiply By Time Base .5 ms /div Total seconds = .5ms/div x 2.2 div=1.10ms 1.1ms=.0011s
Calculate the Frequency F = Frequency in Herz (Hz) t = Period in seconds
Measuring Voltage • Position the wave on the scope. • Determine the amplitude of the wave - The top and bottom. • Read the number of divisions. • Multiply the number of divisions by the • volts/division on the voltage range knob.
3.4div Read Number of Divisions Reading peak to peak voltage
2 Volts/Div Using channel 1 Multiply By Volts/Div 2Volts/Div x 3.4Div =6.8Volts