Download
1 / 7
70 likes | 155 Vues
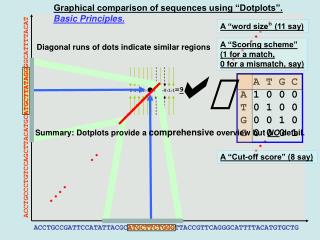
Dotplots. Dotplots. A dotplot is a relatively straightforward type of graph. Similar to the bar graph, except the data is numerical (usually discrete) and instead of bars being drawn to a height, dots are plotted above their corresponding values.

E N D
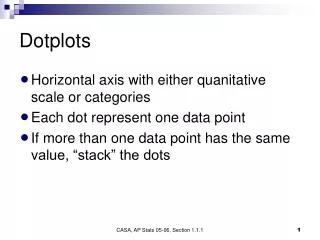
Dotplots • A dotplot is a relatively straightforward type of graph. • Similar to the bar graph, except the data is numerical (usually discrete) and instead of bars being drawn to a height, dots are plotted above their corresponding values. • The dotplot does a good job of displaying the shape, location and spread of the distribution, as well as showing evidence of clusters and outliers. • For small datasets a dotplot is easy to construct, so the dotplot is a particularly valuable tool for quickly describing the distribution without technology.
Dotplots • Consider a dataset representing the ages of CEOs. • The data is: 32 33 36 37 38 40 41 43 43 44 44 45 45 45 45 46 46 47 47 47 48 48 48 48 49 50 50 50 50 50 50 51 51 52 53 53 53 55 55 55 56 56 56 56 57 57 58 58 59 60 61 61 61 62 62 63 69 69 70 74
Dotplots • To create the dotplot, begin with a number line with each integer marked from 32 to 74. • For the data point 32, place a dot above the mark for 32 on the number line. • For the data point 33, place a dot above the mark for 33 on the number line. • For the data point 36, place a dot above the mark for 36 on the number line. • For the first data point 43, place a dot above the mark for 43 on the number line. • For the second data point 43, place a second dot above the first dot over the 43 on the number line.
Dotplots • Eventually, it looks like… • The above plot was completed in StatCrunch.
Dotplots • Notice the center, shape, and spread of the distribution. • It seems to be centered around 50. • It is fairly spread out, from the low 30s to mid-70s. • The shape is roughly bell-shaped, though quite flat. • There don’t seem to be any outliers, though the 4 oldest CEOs are separated by a good amount. • At this point in time, discussions of center, shape, spread, and outliers are informal.
Dotplots • This concludes the presentation.