Download
1 / 30
320 likes | 545 Vues
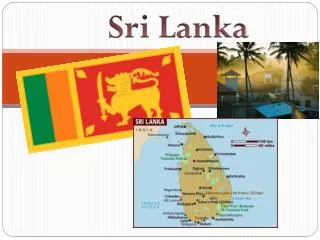
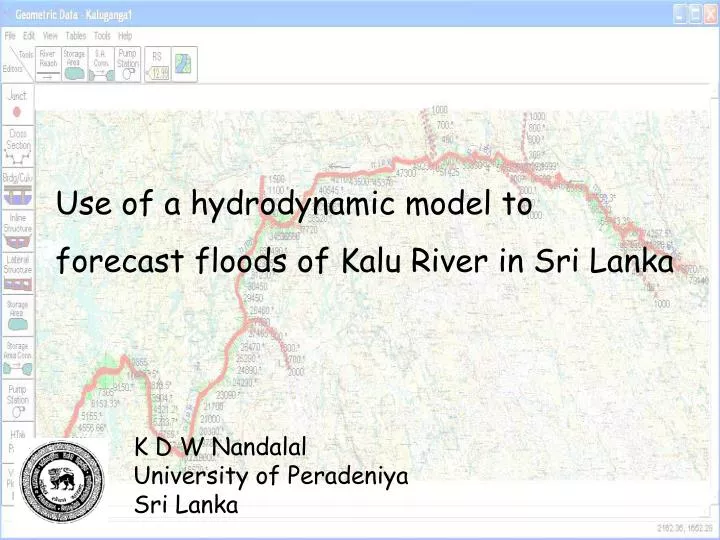
Use of a hydrodynamic model to forecast floods of Kalu River in Sri Lanka. K D W Nandalal University of Peradeniya Sri Lanka. Kalu Ganga is the third largest river in Sri Lanka. Catchment area is 2690 km 2. River basin lies entirely within wet zone.

E N D
Use of a hydrodynamic model to forecast floods of Kalu River in Sri Lanka K D W Nandalal University of Peradeniya Sri Lanka
Kalu Ganga is the third largest river in Sri Lanka Catchment area is 2690 km2 River basin lies entirely within wet zone Source located 2250 m MSL and traverses about 100 km, before it enters the sea at Kalutara
Average annual rainfall is 4000 mm. It ranges from2750 mm from coastal areas to 5250 mm in mountains Discharges the largest volume of water to the sea Annual flow volume is more than 7300 x 106 m3
Catchment upto Ratnapura is 615 km2 River bed elevation at Ratnapura is 13.7 m MSL Ratnapura Town subjects to flood when river level rises to 20 m MSL Flooding of Ratnapura Town had been a frequent occurrence These floods flow along the river inundating low level areas Finally Kalutara is affected by floods
HEC RAS Hydrologic Engineering Center - River Analysis System Developed by; US Army Corps of Engineers The HEC RAS is comprised of a graphical user interface (GUI), Separate hydraulic analysis components, data storage and management capabilities, graphics and reporting facilities
General Philosophy of the Modeling System • The HEC-RAS system contains three one dimensional analysis components for; • steady flow water surface profile computations; • unsteady flow simulation; and • movable boundary sediment transport computations A key element is that all three components will use a common geometric data representation and common geometric and hydraulic computation routines
Overview of Hydraulic Capabilities HEC-RAS is designed to perform one-dimensional hydraulic calculations for a full network of natural and constructed channels User Interface File management Data entry and editing Hydraulic analysis Tabulation and graphical display of input and output data Reporting facilities On-line help
Steady Flow Water Surface Profiles This component is intended for calculating water surface profiles for steady gradually varied flow Can handle a full network of channels, a dendritic system or a single river reach Capable of modeling subcritical, supercritical and mixed flow regime water surface profiles
The basic computational procedure is based on the solution of the one-dimensional energy equation Energy losses are evaluated by friction (Manning's equation) and contraction/expansion (coefficient multiplied by the change in velocity head) The momentum equation is utilized in situations where the water surface profile is rapidly varied These situations include mixed flow regime calculations (i.e., hydraulic jumps), hydraulics of bridges, and evaluating profiles at river confluences (stream junctions)
Unsteady Flow Simulation This component is capable of simulating one-dimensional unsteady flow through a full network of open channels Model can perform mixed flow regime (subcritical, supercritical, hydraulic jumps, and drawdowns) calculations
Graphics and Reporting Graphics include X-Y plots of the river system schematic, cross-sections, profiles, rating curves, hydrographs, and many other hydraulic variables A three-dimensional plot of multiple cross-sections is also provided Tabular output is available Users can select from pre-defined tables or develop their own customized tables
DEVELOPMENT OF THE MODEL The Kalu River reach from Ratnapura to Kalutara was modeled using HEC-RAS (version 3.1.3) flood simulation package The model requires the plan and cross sections of the river, upstream and downstream boundary conditions, details of in-line structures along the river, hydraulic properties of the river and discharge scenarios
Kalu River Study Reach and Geometric Database Study reach extends from Ratnapura to Kalutara about 79 km
River from Ratnapura to Kalutara in the model 86 surveyed cross section details were used Six major tributaries join the Kalu River NiriElla River, Kuru River, Galatara Oya, Yatipawa Ela, Morawak Oya, Kuda River
Model Calibration Calibration parameter is channel resistance; Manning’s n By trial and error, the most suitable values for the Manning’s n were found Water level and discharge data at three locations, Ratnapura, Ellagawa and Putupaula, were used to calibrate the model
Flows upstream of Kalu River and its six tributaries in m3/s observed and model computed water levels
Steady flow Model Outputs Water level (river profile) along the river 3 D view of river from station 79140 to 77090 (about 2 km)
Unsteady flow Simulation When a flood wave moves down a river, the shape/magnitude of the flood wave gets modified Calibrated model for the Kalu River can be used to study the movement of floods along it
Fifty different floods were created and their movement was simulated Similar tables could be developed for any station along the river and such information could be used to warn people of possible floods with the aim of minimizing flood damages
People in the rural areas (less developed) with very low technical knowledge could be able to read and understand such tables A set of similar tables for a few locations were developed to predict flood levels based on upstream observations and were given to rural communities along the river
CONCLUSIONS Model developed can be used to predict water level along the river stretch from Ratnapura to Kalutara for different water flows in the river Model provides the extent of inundation on both banks along the river. The model uses river cross section details at 86 locations along the river obtained from a field survey and the flood plain elevations read from 1:10,000 topo-sheets. The accuracy of the results depends on the accuracies expressed by these data
Probability that the water level at a downstream location rises above a certain level for different water levels observed at an upstream location can be obtained from the model This result can be used to warn people in downstream areas by upstream communities based on the floods that they experience