Download
1 / 1
10 likes | 133 Vues
Arctic Mixed-Phase Cloud Properties Derived from Surface-Based Sensors. Matthew D. Shupe a,b , Sergey Y. Matrosov a,b , Taneil Uttal b a Cooperative Institute for Research in Environmental Sciences – University of Colorado

E N D
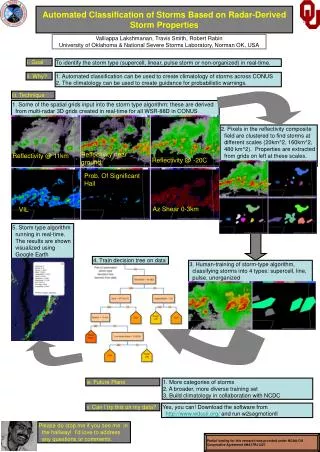
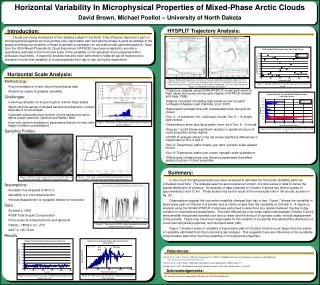
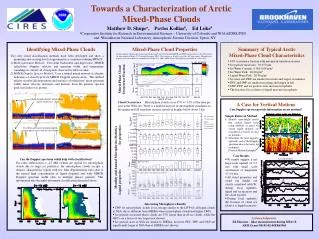
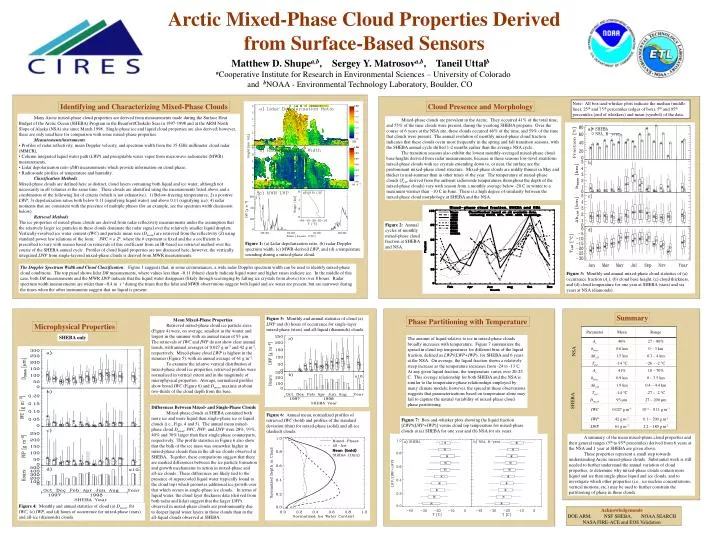
Arctic Mixed-Phase Cloud Properties Derived from Surface-Based Sensors Matthew D. Shupea,b, Sergey Y. Matrosova,b, Taneil Uttalb aCooperative Institute for Research in Environmental Sciences – University of Colorado and bNOAA - Environmental Technology Laboratory, Boulder, CO Note: All box-and-whisker plots indicate the median (middle line), 25th and 75th percentiles (edges of box), 5th and 95th percentiles (end of whiskers) and mean (symbol) of the data. Identifying and Characterizing Mixed-Phase Clouds Cloud Presence and Morphology • Many Arctic mixed-phase cloud properties are derived from measurements made during the Surface Heat Budget of the Arctic Ocean (SHEBA) Program in the Beaufort/Chukchi Seas in 1997-1998 and at the ARM North Slope of Alaska (NSA) site since March 1998. Single-phase ice and liquid cloud properties are also derived; however, these are only used here for comparison with some mixed-phase properties. • Measurements/instruments: • Profiles of radar reflectivity, mean Doppler velocity, and spectrum width from the 35-GHz millimeter cloud radar (MMCR), • Column integrated liquid water path (LWP) and precipitable water vapor from microwave radiometer (MWR) measurements, • Lidar depolarization ratio (DR) measurements which provide information on cloud phase, • Radiosonde profiles of temperature and humidity. • Classification Methods: • Mixed-phase clouds are defined here as distinct, cloud layers containing both liquid and ice water, although not necessarily in all volumes at the same time. These clouds are identified using the measurements listed above and a combination of the following list of criteria (which is not exhaustive): 1) Below-freezing temperatures; 2) a positive LWP; 3) depolarization ratios both below 0.11 (signifying liquid water) and above 0.11 (signifying ice); 4) radar moments that are consistent with the presence of multiple phases (for an example, see the spectrum width discussion below). • Retrieval Methods: • The ice properties of mixed-phase clouds are derived from radar reflectivity measurements under the assumption that the relatively larger ice particles in these clouds dominate the radar signal over the relatively smaller liquid droplets. Vertically-resolved ice water content (IWC) and particle mean size (Dmean) are retrieved from the reflectivity (Z) using standard power law relations of the form: IWC = a Zb, where the b exponent is fixed and the a coefficient is prescribed to vary with season based on retrievals of this coefficient from an IR-based ice retrieval method over the course of the SHEBA annual cycle. Profiles of cloud liquid properties are not discussed here; however, the vertically integrated LWP from single-layered mixed-phase clouds is derived from MWR measurements. Mixed-phase clouds are prevalent in the Arctic. They occurred 41% of the total time, and 55% of the time clouds were present, during the yearlong SHEBA program. Over the course of 6 years at the NSA site, these clouds occurred 46% of the time, and 59% of the time that clouds were present. The annual evolution of monthly mixed-phase cloud fraction indicates that these clouds occur most frequently in the spring and fall transition seasons, with the SHEBA annual cycle shifted 1-2 months earlier than the average NSA cycle. The transition seasons also exhibit the lowest monthly-averaged mixed-phase cloud base heights derived from radar measurements, because in these seasons low-level stratiform mixed-phase clouds with ice crystals extending down to, or near, the surface are the predominant mixed-phase cloud structure. Mixed-phase clouds are mildly thinner in May and thicker in mid-summer than in other times of the year. The temperature of mixed-phase clouds (Tcld, derived from the ambient radiosonde temperatures throughout the depth of the mixed-phase clouds) vary with season from a monthly average below -20 C in winter to a maximum warmer than -10 C in June. There is a high degree of similarity between the mixed-phase cloud morphology at SHEBA and the NSA. Figure 2: Annual cycles of monthly mixed-phase cloud fraction at SHEBA and NSA. Figure 1: (a) Lidar depolarization ratio, (b) radar Doppler spectrum width, (c) MWR-derived LWP, and (d) a temperature sounding during a mixed-phase cloud. The Doppler Spectrum Width and Cloud Classification: Figure 1 suggests that, in some circumstances, a wide radar Doppler spectrum width can be used to identify mixed-phase cloud conditions. The top panel shows lidar DR measurements, where values less than ~0.11 (blues) clearly indicate liquid water and higher ratios indicate ice. In the middle of this case, both DR measurements and the MWR LWP indicate that the liquid water disappears (likely through scavenging by falling ice crystals from above) for over 8 hours. Radar spectrum width measurements are wider than ~0.4 m s-1 during the times that the lidar and MWR observations suggest both liquid and ice water are present, but are narrower during the times when the other instruments suggest that no liquid is present. Figure 3: Monthly and annual mixed-phase cloud statistics of (a) occurrence fraction (Ac), (b) cloud base height, (c) cloud thickness, and (d) cloud temperature for one year at SHEBA (stars) and six years at NSA (diamonds). s Summary Figure 5: Monthly and annual statistics of cloud (a) LWP and (b) hours of occurrence for single-layer mixed-phase (stars) and all-liquid (diamonds) clouds. Mean Mixed-Phase Properties Retrieved mixed-phase cloud ice particle sizes (Figure 4) were, on average, smallest in the winter and largest in the summer with an annual mean of 93 mm. The retrievals of IWC and IWP do not show clear annual trends, with annual averages of 0.027 g m-3 and 42 g m-2, respectively. Mixed-phase cloud LWP is highest in the summer (Figure 5), with an annual average of 61 g m-2. To examine the relative vertical distribution of mixed-phase cloud ice properties, retrieved profiles were normalized in vertical extent and in the magnitude of microphysical properties. Average, normalized profiles show broad IWC (Figure 6) and Dmean maxima at about two-thirds of the cloud depth from the base. Phase Partitioning with Temperature Microphysical Properties SHEBA only The amount of liquid relative to ice in mixed-phase clouds broadly increases with temperature. Figure 7 summarizes the spread in cloud top temperatures for different bins of the liquid fraction, defined as LWP/(LWP+IWP), for SHEBA and 6 years at the NSA. On average, the liquid fraction shows a relatively steep increase as the temperature increases from -24 to -13 C. At any given liquid fraction, the temperature varies over 20-25 C. This average relationship for both SHEBA and the NSA is similar to the temperature-phase relationships employed by many climate models; however, the spread in these observations suggests that parameterizations based on temperature alone may fail to capture the natural variability of mixed-phase cloud phase partitioning. NSA SHEBA Differences Between Mixed- and Single-Phase Clouds Mixed-phase clouds at SHEBA contained both more ice and more liquid than single-phase ice or liquid clouds (i.e., Figs. 4 and 5). The annual mean mixed-phase cloud Dmean, IWC, IWP, and LWP were 28%, 93%, 40% and 30% larger than their single phase counterparts, respectively. The profile statistics in Figure 6 also show that the bulk of the ice mass was somewhat higher in mixed-phase clouds than in the all-ice clouds observed at SHEBA. Together, these comparisons suggest that there are marked differences between the ice particle formation and growth mechanisms in action in mixed-phase and all-ice clouds. These differences are likely tied to the presence of supercooled liquid water (typically found at the cloud top) which promotes additional ice growth over that which occurs in single-phase ice clouds. In terms of liquid water, the cloud layer thickness data (derived from both radar and lidar) suggest that the larger LWPs observed in mixed-phase clouds are predominantly due to deeper liquid water layers in those clouds than in the all-liquid clouds observed at SHEBA. Figure 6: Annual mean, normalized profiles of retrieved IWC (bold) and profiles of the standard deviation (thin) for mixed-phase (solid) and all-ice (dashed) clouds. Figure 7: Box-and-whisker plots showing the liquid fraction [LWP/(LWP+IWP)] versus cloud top temperature for mixed-phase clouds at (a) SHEBA for one year and (b) NSA for six years. A summary of the mean mixed-phase cloud properties and their general ranges (5th to 95th percentiles) derived from 6 years at the NSA and 1 year at SHEBA are given above. These properties represent a small step towards understanding Arctic mixed-phase clouds. Substantial work is still needed to further understand the annual variation of cloud properties, to determine why mixed-phase clouds contain more liquid and ice than single-phase liquid and ice clouds, and to investigate which other properties (i.e., ice nucleus concentrations, vertical motions, etc.) may be used to further constrain the partitioning of phase in these clouds. Figure 4: Monthly and annual statistics of cloud (a) Dmean, (b) IWC, (c) IWP, and (d) hours of occurrence for mixed-phase (stars) and all-ice (diamonds) clouds. Acknowledgements DOE ARM, NSF SHEBA, NOAA SEARCH NASA FIRE-ACE and EOS Validation