Download
1 / 19
200 likes | 321 Vues
Burden of Disease: Osteoarthritis. Joanne M. Jordan, MD MPH Bone and Joint Decade October 2009. O A Epidemiology. 27 million Americans in 2005 21 million in 1995 25% of those 60 years and older with significant OA-related pain and disability Highest cause of work loss in U.S .

E N D
Burden of Disease: Osteoarthritis Joanne M. Jordan, MD MPH Bone and Joint Decade October 2009
OA Epidemiology • 27 million Americans in 2005 • 21 million in 1995 • 25% of those 60 years and older with significant OA-related pain and disability • Highest cause of work loss in U.S. • $22 billion • Interferes with physical activity to treat DM, CVD
OA Epidemiology • Direct medical costs • $1000to $4100 (in 2006 USD)/person-year from adults > 60 years with symptomaticknee OA • 82% of hip replacements • 97% of knee replacements • 500,000 TKAs in US in 2005 costing > $11 billion
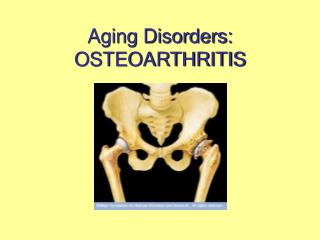
OA: Risk factors Occupation Aging Genetics Diet Joint injury Obesity
Lifetime risk of sx Knee OA • Murphy L, et al. Arthritis Rheum 2008;59(9):1207-13.
Prevalence of symptomatic OA in the hands, knees, and hips, from US population-based studies* * Adjusted to the projected 2000 population age ≥18 years except for National Health and Nutrition Examination Survey III (NHANES III) estimates, which were adjusted to the 1980 Census population. OA = osteoarthritis.
Prevalence of knee osteoarthritis around the globe Bull World Health Organ vol.81 no.9, Sept. 2003
Knee OA in Beijing vs Framingham Caucasians Arthritis Rheum 2001; 44: 2065-2071
Knee OA in rural vs. urban Chinese, age 59 – 84 yrs Age-standardized PR (95% CI) Men Severe radiographic OA 2.48 (1.62–3.78) Symptomatic OA 1.91 (1.25–2.91) Women Severe radiographic OA 1.42 (1.03–1.97) Symptomatic OA 1.55 (1.17–2.05)
Odds Ratios for knee OA in African Americans compared to Caucasians • TF-OA (K-L grade) ♂ : aOR= 1.36 (1.00-1.86) aPOR= 2.08 (1.19-3.65) ♀: aOR= 1.00 (0.81-1.23) aPOR= 1.56 (1.06-2.29) Femur Tibia • Braga L, et al. Osteo & Cart 2009 September [Epub ahead of print].
9 Mutually exclusive phenotypes • Isolated: • Hand • TFJ (knee) • PFJ • Hip • Combinations: • TFJ/PFJ • Hand/knee • Hand/hip • Knee/hip • Hand/knee/hip
Phenotypes LESS common in AAs Unadjusted Frequencies Adjusted Odds Ratio by Race p<0.001 p=0.02 p<0.001 % *Adjusted for age, gender, BMI Fisher’s exact test and exact logistic
Phenotypes MORE common in AAs Unadjusted Frequencies Adjusted Odds Ratio by Race p<0.001 p<0.01 p<0.01 % p=0.02 *Adjusted for age, gender, BMI
OA Burden: Summary OA is common. Prevalence predicted to increase due to aging and obesity Increasing impact on disability, quality of life, direct and indirect costs