Download
1 / 45
500 likes | 826 Vues
Chapter 3: Surface Water Hydrology. What is Surface Water Hydrology? Watersheds Overland Flow Rivers Lakes Sediment Transport and Deposition Water Measurement Flood Events.

E N D
Chapter 3: Surface Water Hydrology • What is Surface Water Hydrology? • Watersheds • Overland Flow • Rivers • Lakes • Sediment Transport and Deposition • Water Measurement • Flood Events
Figure 3.1Leonardo da Vinci was fascinated by the similarities between the organization of rivers on the surface of the Earth and the human circulatory system.
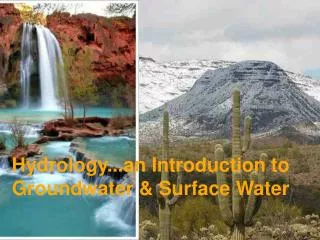
What is Surface Water Hydrology? • The study of moving water found in rivers, open channels, lakes, and runoff across the open land surface • Important for transportation, irrigation, water supply, hydropower, etc. • Related topics: • Ground water (below the surface) • Marine water (in the oceans) • Icecaps and glaciers
Watersheds • The total land area that drains to a common point. • Also called a river basin, drainage basin, or catchment • The watershed is delineated by finding the watershed divide, or ridge, that separates the watershed from its neighbors
Figure 3.5 The Mississippi River is the third largest drainage basin in the world, exceeded in size only by the watersheds of the Amazon River in South America and the Zaire River in Africa.
Three Simple Rules • Ridges are indicated by the highest elevation contour line • Surface water generally flows at right angles (perpendicular) across contour lines • Drainages are indicated by flow lines (also called streamlines) that point downstream
Topographic Maps: • Used to show slope, elevation, distance, and physical features • Scale: • Used to relate the distance on the map to the true distance. • 1 map inch = 12,000 true inches = 2000 true feet • Contour Line: • Used to show points of similar elevation. • 1000 foot contour line is a constant elevation above sea level • Contour Interval: • The distance between contour lines. A 20 foot contour interval has contours every 20 feet, i.e., 980, 1000, 1020, etc. • Slope: • The steepness of the ground • A 1% slope is where the surface drops 1 foot every 100 feet. • Aspect: • The direction that the slope faces, North, South, East, West, etc.
Overland Flow • Rain falls onto vegetation, and then to the ground. • Interception is lost in the vegetation • Throughfall makes it to the ground • Stemflow runs down the vegetation • Water reaching the ground can: • Accumulate in depressions • Soak into the ground (infiltration) • Flow across the surface as overland flow
Rivers • Components of a River • Headwaters: the source of the river • Tributaries: smaller streams that combine at a confluence • Upstream vs. Downstream: related to the flow direction • Thalveg: Main part of river channel • Hyporheic Zone: Shallow ground-water flow below the river bed
River Morphology: • Young, “V” shaped valleys • Older, “U” shaped valleys • Oldest, meandering channels with oxbow lakes • Braided channels with lots of sediment • Channels are choked with sediments • Below glacial terrain • In wetlands where there is very low gradient (slope)
Types of Rivers • Ephemeral: flows only during storms • Intermittent: flows seasonally • Losing stream: loses flow to groundwater • Gaining stream: gains water from the subsurface • Gradient: the slope or fall of the river, usually decreases as the river gets larger.
Figure 3.6 Cross section of a gaining (or “effluent”) stream, common in humid regions, and a losing (or “influent”) stream, often found in arid or semiarid locations.
Lakes • Any body of water (other than an ocean) that is of reasonable size, impounds water, and moves very slowly • Types of lakes: • cirques: formed in mountains by glaciers • pluvial: formed in deserts • kettles: formed by buried glacial ice that melted • Lake productivity • oligotrophic: very low productivity, clear • eutrophic: very high productivity, green
Ecologic Zones • littoral: along the shoreline • limnetic: near the surface in the deeper parts • profundal: near the bottom in the deeper parts • Thermal Cycles • epiliminion: near the surface, warm in summer • hypolimnion: near the bottom, cold in summer • thermocline: boundary between epi- and hypolimnion • lake turnover: in fall when epi- and hypolimnion mix • Seiche: • Wind driven water level fluctuations
Figure 3.8 Seasonal layering and turnover in a lake at mid-latitudes.
Sediment Transport and Deposition • This refers to soil carried by water and then deposited in low energy environments. • The heavy sediments (sands) fall out along the river banks, forming levees • Finer materials (clays and silts) fall out in flood plains • Yazoo rivers parallel the main river • A delta forms where the sediment chokes the main channel - often in braided rivers.
Velocity • High energy streams have high velocities • Higher velocities can carry more, and larger particles • Sorting occurs when large particles are left behind, and small particles are carried away • Sediment Load • The total material carried, composed of: • Suspended load: fine materials carried as particles • Dissolved load: materials that are in solution • Bedload: larger materials carried along the bottom • Sediment Yield: The load per unit area
Figure 3.11 Steep gradients and high water velocity are great combinations for moving boulders, sediment, and kayakers.
Water Measurement • Rational Formula • Q = C i A • Q is the peak runoff rate, cfs • C is the runoff coefficient • Urban areas, C = 0.9 • Industrial areas, C = 0.8 • Residential areas, C = 0.6 • Forested areas, C = 0.1 • i is the rainfall intensity, in/hr • A is the watershed area, acres
River Discharge • Discharge is the flow of water • Measured in units of cubic feet per minute, or cfs • The metric equivalent is liters per second, or Lps • We find the discharge, Q, by taking the product of the velocity, v, and the area, A: • Q = V A • Example, if the width of the channel is ten feet, the depth is one foot, and the velocity is two feet per second, then • A = 10 ft x 1 ft = 10 ft2 • Q = 2 ft/s x 10 ft2 = 20 cfs
Figure 3.10 One cubic foot per second, or cfs (or one cubic meter per second, or cms) is equivalent to one cubic foot (or meter) of water flowing past a given point in a one-second time interval.
The water velocity is found using a flowmeter, which looks like an anemometer:
Figure 3.13 The hydrograph of a river can look similar to this example after a brief but intense rainfall event.
To make things easy, we use a staff gage (or ruler) to measure the river stage (how high the river is. • We use a rating curve to relate the discharge to the river stage.
Water Storage in Lakes and Reservoirs • We normally measure large volumes of water in units of Acre-Feet • 1 acre-foot is the volume of water that covers one acre to a depth of one foot • Lake Lanier, when full, has 2,000,000 acre-feet of water. It covers 40,000 acres with an average depth of 50 feet. • We keep track of the volume using the stage-capacity curve: • The storage goes down as the water level, or stage, goes down
Flood Events • Flood frequency: • the likelihood that a large flood will happen • 100-year flood: • flood that is exceeded - on average - once every 100 years, the probability in 1 year is 1/100 = 1 % • 10-year flood: • probability = 10 % • Mean annual flood: • exceeded once every two years, probability = 50%
Figure 3.15 Flood damage can be predicted based on the intensity of a storm and the topography of a region.
Extreme Events • Probable Maximum Precipitation (PMP) • The most extreme rainfall possible • Used for estimating the effects of extreme weather • Probable Maximum Flood (PMF) • The most extreme flood possible • Used for estimating maximum extent of flooding
GIS Mapping • Geographic Information Systems (GIS): • Used to organize spatial information • Various properties are stored in the computer • GIS layers include topography, soils, hydrography, vegetation, land use, etc.
Figure 3.16 A GIS map display showing the schools in a town. Notice that a query of Elmar High School was made, and the corresponding attribute data and digital image are shown.
Figure 3.17 Streams, lakes and medical facilities are added to the original map display.
Figure 3.19 With the Q100 layer added to the map display, it is easy to see that Edwards Elementary is the only school in the 100-year floodplain.
Quiz 3 • If the Oconee River is flowing at a rate of 1000 ft3/s, how long would it take to fill this room? • Use the tape measure provided to measure the length, width, and height of the room, and calculate the volume, in cubic feet. [or use L = 60’, W = 100’, H = 12’] • Calculate the time by dividing the volume (ft3) by the flow rate (ft3/s), giving you the time, in seconds. • Delineate (draw the boundary around) the Oconee River Watershed using the map found at: www.hydrology.uga.edu/Georgia.pdf • True - False Questions: [T / F] Overland flow is more likely in forested watersheds because it rains harder there [T / F] Urban areas have higher runoff peaks than agricultural areas [T / F] Sand is easier for rivers to carry than clays [T / F] A 100-year flood has a 1 percent chance of happening in any one year [T / F] The Probable Maximum Precipitation is the largest observed rain in a year. • If Athens is located 300 river miles from the coast, and the river flows at a rate of 3 miles per hour, how long will it take the water to reach the ocean? • For the previous problem, what would happen if there is a lake between Athens and the coast?