Download

1 / 19
230 likes | 518 Vues
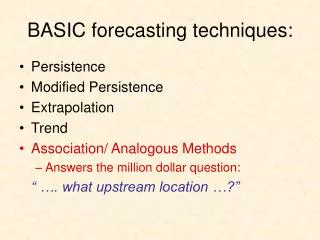
Demand Forecasting Techniques. Push-Pull Strategy. Generally implies, …a business pushing products or services or information to customers (Push Strategy) …Customers pulling products or services or information from a business (pull strategy). MARKETING/ADVERTISING.

E N D
Push-Pull Strategy Generally implies, • …a business pushing products or services or information to customers (Push Strategy) • …Customers pulling products or services or information from a business (pull strategy) MARKETING/ADVERTISING • A situation when a company keeps repeating an advertisement • A situation when a company stops advertising for some time to get viewers to ask/look for more about the product Push Pull • Forecasting inventory to meet demand • Company begins with customer order INVENTORY CONTROL Push Pull
Planning for Push-Pull in Supply Chain Management • Using Forecasting tools (Time Series Analysis) on: • Historical or past demand • Lead time of product • Planned advertising or marketing efforts • State of the economy • Planned price discounts • Actions that competitors have taken
Understanding Objective of Forecasting Example: Wal-mart’s decision on discounting prices of a detergent during the month of July must be shared with manufacturer, transporter, and others in the supply chain that are affected by the forecast of demand • Should all supply chain participants get involved in demand forecasting? Why? • What would happen if participants are not informed about Wal-Mart’s decision?
Integrate Demand Planning and Forecasting Through Supply Chain • Planning activities include: • Capacity Planning • Production planning • Promotion planning • Purchasing Planning, etc • Accomplishing integration by having a cross-functional team
Understand and Identify Customer Segments • Customers may be grouped by • Similarities • Service Requirements • Demand volumes • Order frequency • Demand volatility • Seasonality
Understanding Major factors Influencing Demand Forecast Example: A super market promoted a certain brand in July 2012 leading to high demand in that month. Demand for this brand will be high again in July 2013 only if it is promoted again in this month Example: Sugarcane is continuously grown for 6 -7 months in a year and sugar cane mills can procure sugarcane to transform them into sugar during this season. (Planting in Maharashtra is done between July and August. Crop matures in 13-15 months)
Determine Appropriate Forecasting Technique • Dimensions of data • Geography • Product groups • Customer groups • Four methods • Qualitative • Time Series • Causal • Simulation
Establish Performance and Error Measures for Forecast • Measures should be highly correlated with the objectives of the business decisions based on these forecasts • Example: A mail-order company that uses forecast to place orders with its suppliers up the supply chain . Suppliers take two months to send in the orders. The mail-order must ensure that the forecast is created at lease two months before the start of the sales season because of the 2-month lead time for replenishment.
Measures • Moving Averages • Exponential Smoothing • Trend Analysis • Other techniques in case of unavailable or limited information (More speculative than above mentioned) • CAGR • Best-case & Worst-case scenarios
Moving Averages (MA) Sales for December, January, February and March were 350, 400, 360 and 410 units respectively. Calculate the forecast for the month of April using 3-period and 4-period moving averages 3-period MA = (400+360+410)/3 = 390 units 4-Period MA = (350+400+360+410)/4 = 380
Exponential Smoothing Forecast (Ft-1)for 2010-11 was 10,000 units and actual sales (Dt-1) for 2010-11 was 11,000. Calculate forecast for year 2011-12(Ft) using exponential smoothing if alpha or the constant (α) = 0.2 Ft = α Dt-1 + (1 – α) Ft-1 Ft = (0.2 X 11000) + (1 – 0.2) X 10,000 = 10,200 units
Another Example - MA Find demand forecast for 2013 using 3 period moving average 4 period moving average 6 period moving average
Another Example – Trend Analysis Find demand forecast for 2013 using Trend Analysis
Forecasting with Linear trend Yi = a + bXi Σ Σ Yi XiYi a = b = Σ n Xi2 where Xi equals a particular time period ‘t’ minus mid-level time period (for odd number of observations). For even number of observations, Xi = 2d, d = t – mid-point year ^ ^ Yi = a + bXi, Yi equals estimated values of Yi used for forecasting future Yi
Coefficient of Determination (R2 and adjusted R2) R2 = 1 – Adj. R2 = 1 – Sum of squared errors ᶺ Σ (Yi – Y)2 Σ (Yi – Y)2 (n – 1) (1 – R2) * (n – k – 1) Degrees of freedom
CAGR & Best-Case & Worse-case (1/No. Years) - 1 CAGR = (Ending value/Beginning Value) Best Case & Worst Case Mean + Z-critical value X Mean - Z-critical value X Standard Deviation BEST N Standard Deviation WORST N Z-critical values for 90%, 95% and 99% confidence intervals are 1.645, 1.96 and 2.58 respectively
bhaktij@gmail.comwww.headscratchingnotes.netwww.pramaanam.combhaktij@gmail.comwww.headscratchingnotes.netwww.pramaanam.com
sources • http://www.gsb.stanford.edu/news/bmag/sbsm1008/feature-lee.html • http://kelley.iu.edu/mabert/e730/Chopra-Chap-7.pdf