Download
1 / 31
310 likes | 530 Vues
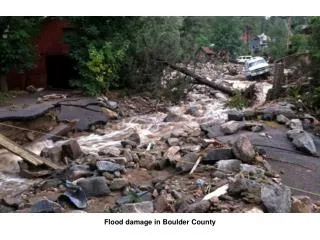
Boulder Reservoir Flood September 2013. Jim Shelley City of Boulder RMWQAA 2014 Symposium 4/25/2014. Acknowledgements. City of Boulder Drinking Water Quality Lab Zach Lelwica Anu Thorat City of Boulder Waste Water Quality Lab Kurt Keilbach Melissa Mimna Rick Dingeman.

E N D
Boulder ReservoirFlood September 2013 Jim Shelley City of Boulder RMWQAA 2014 Symposium 4/25/2014
Acknowledgements • City of Boulder Drinking Water Quality Lab • Zach Lelwica • Anu Thorat • City of Boulder Waste Water Quality Lab • Kurt Keilbach • Melissa Mimna • Rick Dingeman
Presentation Topics Flood Water Sources Reservoir Net Volume Increase Tributary Flood Photos and Water Quality Data Tributary Loads Reservoir Condition Before and After the Flood 14 year trends showing the historic Sept 2013 flood impact
Three Major Sources of Flood Water into Boulder Reservoir Saint Vrain River Via Boulder Feeder Canal (1000 acft) Dry Creek (200 acft) Six Mile Reservoir Spillway (1400 acft)
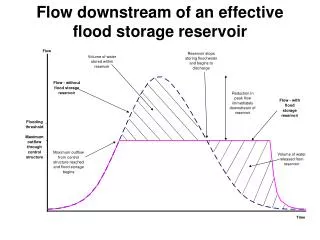
Boulder Reservoir Volume Increase from Flood • 3200 acft volume gain 48 hours 9/12 through 9/14 • Estimated 600 acft from 12 inches rain • Net gain 2600 acft from flood
Six Mile Reservoir (9/12/13) Water Quality Data (9/17) TSS- 101 mg/L NO3- 0.77 mg/L TP- 254 ug/L DP- 89 ug/L
Saint Vrain River via Boulder Feeder Canal (9/13/13) Water Quality Data (9/17) TSS- 44 mg/L NO3- 1.58 mg/L TP- 118 ug/L DP- 42 ug/L
Dry Creek (9/13/13) Water Quality Data (9/17) TSS- 50 mg/L NO3- 1.52 mg/L TP- 206 ug/L DP- 78 ug/L
Boulder Reservoir Estimated Flood Loading Rates • TSS – 530,841 lbs 265 tons 221 cubic yards (2.2x avg annual load) • NO3 as N - 9036 lbs (3.7x) • TP - 1352 lbs (1.6x) • DP - 490 lbs (1.5x)
Boulder Reservoir Post Flood Metals, VOC’s, SOC’s & EC’s Metals • Al, Fe increased • Be, Cd, Cr, Cu, Pb, Mo, Se, U, Zn slight increases-below aquatic life limits VOC’s- all less than detection SOC’s- all less than detection Emerging contaminants- first time low level hits for Bisphenol A and Triclosan ANS
Boulder Reservoir post flood monitoring will continue focusing on taste and odors, DBP precursors and reservoir condition
Boulder Reservoir post flood monitoring will continue focusing on taste and odors, DBP precursors and reservoir condition
Monitoring will continue focusing on taste and odor, DBP’s and reservoir condition
Tributaries Farmers Dry Creek Little Dry Unk BFC
Physical Characteristics 13,000 acft 580 acres Max Depth 28 ft Mean Depth 23 ft Fetch 1.2 miles Shoreline Length 5.1 miles Shoreline Development 1.51
Monitoring will continue focusing on taste and odor, DBP’s and reservoir condition