Download
1 / 56
560 likes | 795 Vues
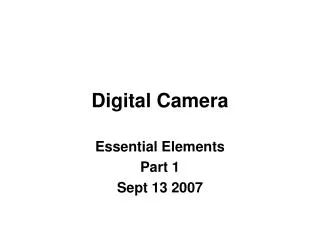
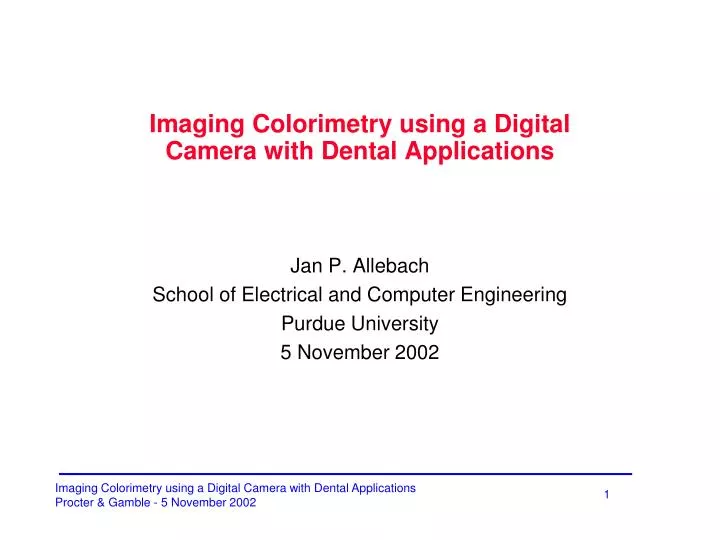
Imaging Colorimetry using a Digital Camera with Dental Applications. Jan P. Allebach School of Electrical and Computer Engineering Purdue University 5 November 2002. Applications of tooth colorimetry: assessment of efficacy of whitening agents. After. Before.

E N D
Imaging Colorimetry using a Digital Camera with Dental Applications Jan P. Allebach School of Electrical and Computer Engineering Purdue University 5 November 2002
Applications of tooth colorimetry:assessment of efficacy of whitening agents After Before Image obtained from: http://www.westcentraldental.com/cosmetic.htm
Applications of tooth colorimetry:matching color of restored tooth to neighbors
Colorimetry research at Purdue • Phase I • Development of theoretical framework for model-based colorimetry system and filter design • Simulation results only • M. Wolski, C. A. Bouman, and J. P. Allebach, “Optimization of Sensor Response Functions for Colorimetry of Reflective and Emissive Objects,” IEEE Trans. on Image Processing, Vol. 5, pp. 507-517, March 1996. • Phase II • Application to colorimetry with a digital camera • Characterization of digital camera • Regression-based approach • Experimental results with color patches and extracted teeth • W. Wu, J. P. Allebach, M. Analoui, “Imaging Colorimetry Using a Digital Camera,” Journal of Imaging Science and Technology, Special issue on color imaging, Vol. 44, pp. 267-279, July/August 2000.
Colorimetry research at Purdue (cont.) • Phase III • Refinement of experimental system • Development of reflectance estimation based approach • Experimental results with extracted and live teeth • D.Y. Ng, J. P. Allebach, Z. Pizlo, and M. Analoui, “Non-Contact Colorimeter for Human Tooth Color Assessment using a Digital Camera,” Proceedings of the IS&T/SID 10th Color Imaging Conference, Scottsdale, AZ, 12 November – 15 November 2002.
Collaborators/Sponsors • Mark Wolski,General Motors Research Laboratory • Color Savvy Systems,Inc. • Indiana University School of Dentistry • Dr. Mostafa Analoui, (now withPfizer,Inc.) • Dr. George Stookey • Indiana 21st Century Fund
Synopsis • What is color? • Phase II • System architecture • Filter design • Preliminary results • Phase III • System refinement • “Clinical” system • Experimental results • Future research (Phase IV?)
Trichromatic Representationof Color for Human Vision • 3-D subspace
Sensor Subspace • Example 1: N = 2 wavelengths, one monochromatic sensor stimuli s1and s2 are metamers to sensor q
Role of Illuminant illuminant modifies sensor response
Effect of Illuminant Metamerism • Example 2: N = 2 wavlengths, two monochromatic sensors stimuli s1and s2 are metamers to sensor q1 but not to q2
Challenges of tooth color measurement • Smooth surface gives rise to specular reflection • Irregular pattern of scattering of light gives rise to non-uniform color on the surface • Irregular size and shape complicate measurements • Fluorescence makes color less predictable A device with high spatial resolution is needed
Measurement device Calibration mapping What is a colorimetry system?
Prior work: colorimetry system design • Calibration mapping • 3 X 3 matrix (Wandell & Farrell, 1993, Finlayson & Drew, 1996) • 3 X 6 matrix (Farrell et al, 1994) • Measurement device • Design a device (Wolski et al, 1996) • Alter device sensitivity (Chen & Trussell, 1995) • Increase the number of device channels (Tominaga 1999, Haneishi et al, 1995)
Prior Work: colorimetry with a digital camera • Two main approaches have been adopted: • Physics-based approach: • Model the electro-optics of the camera, [Daligault, 1991], [Quan et al, 2000], no experiments have been reported. • Statistically-based approach: • Focus on what the camera ‘sees’ instead of how the camera ‘sees’ • Linear regression is widely used • Results have been reported for color patches such as MacBeth Color Checkers ( [Lenz, 1996], [Balas, 1997]), Munsell Color Chips ( [Finlayson, 1997]) and IT8 target ( [Pointer, 2001])
Phase II research • Digital camera + filters & calibration matrices • Attack the problem simultaneously on both the design of filters in measurement device and the mapping in color calibration • Obtain tristimulus values of a sample under pre-selected illumination conditions rather than recover its reflectance
measurement device illuminant L Camera Filter 1 Camera Filter Nf reflectance r under illuminant L’ Multi-exposure colorimetry system
Multi-exposure colorimetry system • A calibration problem: if filters are given • Model-based or regression-based method • A system design problem: if filter design is desired • Model-based method only • Interaction between measurement device and calibration mapping
System design: notation fi : 31-pt. Filter transmittance of ith filter D: camera sensitivities A: CIE XYZ color matching function
Design goal and approach • Find the “best” F-M’ pair • Small perceptual errors • Robust system • Smooth filter transmittance • How? • RMS errors of linearized DE • Perturbation of F • Cost on filter roughness
System design: summary Minimize: Subject to: • Optimal design through constrained optimization • Restricted search among candidate solution set
Calibration mappings • Model-based method • Regression-based method
Evaluation of system performance • DE in L* a* b* space • T1-T2: error in CIE XYZ space • Mean DE
Design a colorimetry system • Camera sensitivity • Illumination conditions • Training samples • Number of exposures • Robustness and smoothness (Kt,Ks) • Filter design/restricted search
Monochromator Output Camera Sensitivity 5 x 10 2.5 0.12 red 0.1 green 2 blue 0.08 1.5 counts sensitivity 0.06 1 0.04 0.5 0.02 0 0 300 400 500 600 700 800 400 450 500 550 600 650 700 wavelength (nm) wavelength (nm) Camera sensitivity • Request data directly from manufacturer • Estimate it through calibration
Illuminant Spectra Chromaticity Diagram 0.44 25 Flash 0.42 E 20 A A 0.4 F F 15 D65 power y 0.38 10 0.36 5 0.34 Flash E D65 0.32 0 0.3 0.35 0.4 0.45 0.5 400 450 500 550 600 650 700 x wavelength (nm) Illumination conditions • Daylight from viewing booth & camera flash • E, A, F, D65
2 10 Flash E A 1 10 F E D65 D mean 0 10 -1 10 1 2 3 4 5 6 No. of bases Training samples • Application dependent • 120 DuPont paint chips • 170 natural objects • 1269 Munsell color chips
No noise With noise Robustness issue: Ks = 1 Robustness issue: Ks = 1 2 10 7 6 5 E E D 4 D 1 10 mean mean 3 2 1 0 10 0 -8 -6 -4 -2 0 -8 -6 -4 -2 0 10 10 10 10 10 10 10 10 10 10 Kt Kt Smoothness issue: Kt = 1e-4 Smoothness issue: Kt = 1e-4 2 10 7 6 5 E E D 4 D 1 10 mean mean 3 2 1 0 0 10 -2 -1 0 1 2 -2 -1 0 1 2 10 10 10 10 10 10 10 10 10 10 Ks Ks Robustness and smoothness Flash-Flash
1 1 0.8 0.8 0.6 0.6 transmittance transmittance 0.4 0.4 0.2 0.2 0 0 400 450 500 550 600 650 700 400 450 500 550 600 650 700 wavelength (nm) wavelength (nm) Design results Optimal filters Optimal Wratten filters Optimal filter pairs for 2-exposure Flash-{Flash,E,A,F,D65} colorimetry systems when (Kt,Ks) = (10-4,1)
0.1 0.08 0.08 0.06 0.06 sensitivity sensitivity 0.04 0.04 0.02 0.02 0 0 400 450 500 550 600 650 700 400 450 500 550 600 650 700 wavelength (nm) wavelength (nm) Design results (Channelsensitivities) Optimal filters Optimal Wratten filters
1 0.8 0.6 0.4 0.2 0 0 0.5 1 Experimental results Chromaticity Diagram Experimental results on 278 Munsell color chips using Wratten filter pair (WR11+WR38A,WR80B+WR85N6) y x
Phase II conclusion • Comparison • Filters used in regression-based method is the design from model-based technique
Phase III research • Continuation of Wu’s work. • Modify the measurement setup to achieve higher accuracy. Improve prediction of the system • Make the prediction more robust to different illumination conditions. • Adapt the system for clinical use. • Adopt the statistical approach.
Regression Models • Illuminant-Dependent Colorimeter (IDC): • Slight modification of Wu’s Regression Model, use an affine instead of homogeneous calibration matrix • Only output CIE XYZ values • In this model, we calibrate, measure and match the output under the same illuminant • Prediction is only meaningful under the same lighting condition under which the calibration matrix was derived • Illuminant-Independent Colorimeter (IIC): • Output spectral reflectance • In this model, we calibrate and measure under the same illuminant but can match the output under any illuminant
Experiment • Apparatus • Kodak DCS460 Digital Camera • Kodak wratten filters (WR11+WR85N6 and WR38A+WR80B) • Photo Research PR705 spectroradiometer • Experiment 1 • 85 extracted teeth were measured under 3 different light sources: • MacBeth Daylight simulator • 2 AC-powered Vivitar 285 flash units • PL900 DC regulated Halogen light with bifurcated fiber optic light guide • Experiment 2 • 21 human subjects were recruited. The top two incisors of each subjects were measured with Halogen Light
Setup For Experiment 1 • For Daylight simulator, the teeth were placed in the viewing booth. The incident angle of the light is approximately 45 degree
Performance Evaluation • Experiment 1 • In each random selection, 70 of 85 extracted teeth were randomly picked as training set, the remaining 15 comprised the test set. • Experiment 2 • In each random selection, 34 of 42 live human teeth were randomly picked as training set, the remaining 8 comprised the test set. • In both experiments, 10,000 selections were performed. • The average of each selection was recorded.