Download
1 / 37
370 likes | 602 Vues
Population Dynamics Human Populations. Chapter 15 . Human Populations Flourish – 15.1. Human Population Growth 7 billion people 60% of total food energy from wheat, corn and rice. 1 million years ago our ancestors started to walk upright, develop large brains, use tools and fire.

E N D
Population DynamicsHuman Populations Chapter 15
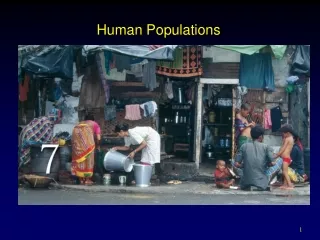
Human Populations Flourish – 15.1 • Human Population Growth • 7 billion people 60% of total food energy from wheat, corn and rice. • 1 million years ago our ancestors started to walk upright, develop large brains, use tools and fire. • 100 000 years ago anatomically modern humans were living as successful hunter-gatherers and spread across the globe. They could learn, communicate, make tools and control fire so they could live in different environments. Plants not as important. • 12 000 years ago living on all landmasses (except Antarctica) with total population of 5 million. Small populations due to nomadic lifestyle, low birth rates, high death rates.
Seeds and Breeds of Change • Huge change was the intentional planting and harvesting of plants, also the domestication of animals. This lead to stationary populations and large families were now possible. • Fewer people needed to plant and farm so other avenues were explored: scholars, artisans and merchants. • Domestication of plants and animals was a key factor to where humans would settle. Many species of plants and animals can not be domesticated or were very difficult to domesticate. • Zebras have never been domesticated and become very dangerous as they age. More zookeepers are injured every year by zebras than by tigers. • Corn had a number of characteristics that made it difficult to use as a food source and that might account for the thousands of years that separate its cultivation from wheat and rice.
The Impact of Disease • Pathogens thrive in sedentary human populations epidemics developed • (any disease that spreads rapidly through a population). • Small pox, tuberculosis and influenza are all believed to have started in domestic animals and spread to humans. • Black Death (bubonic plague) 1348-1350, 100 million killed by the bacteria Yersiniapestis. • European explorers to Aboriginal peoples…resistance had not been developed and mortality was high.
The Impact of Science and Medicine • Biology, Chemistry and Physics started to become major influences in Europe in the 17th century. • Understanding of germs and the cell lead to the beginnings of modern medicine. • Understanding of fossil fuels lead to the beginnings of mechanical energy Industrial Revolution • Fertilizers increased food production; steam energy and internal combustion engine provided unrivalled power for industry. Potential impact on the environment? • Urbanization of populations safe water, sewage systems, vaccines • Science allowed humans to sidestep natural limits of growth that had existed for millions of years.
Human Demographics – 15.2 • Demographics the study of the growth rate, age structure, and other characteristics of human populations. • Since the beginning of the Industrial Revolution (300 years ago) birth rates have remained about the same (30 to 25 births per 1000 individuals/year) however death rates have dropped dramatically (29 to 13 deaths per 1000 individuals/year). Average annual increase of 1.6%. However…
Human Demographics • Time to Get to Each Billion • The recent rate of increase has slowed due to diminishing birth rates.
Human Demographics Domestication of plants, animals Agriculturally based urban societies Beginning of industrial, scientific revolutions
Human Demographics • Age structure of population is what determines the different growth rates. • Growth momentum inherent future growth in a population that results from a disproportionately large fraction of the population being at a younger age.
The Demographic Transition Model • Only factor that alters human population growth are birth and infant death rates. • Older people (beyond reproductive years) that die do not affect population growth. • Demographic transition model four stage model that describes the relationship between economic development and changes in population patterns • Apply this model with caution as a country will be made up of many different groups (geographic and socioeconomic) • Inuit 33 births/1000 individuals compared to rest of Canada 11 births/1000 individuals pre-industrial compared to industrial
Gross National Product (GNP) • total value of all goods and services produced by a country in a particular time frame (usually one year); the value can be given per capita. • Connection between increased GNP per capita and: increased life expectancy, decreased infant mortality rate, decreased fertility rate, increased doubling time (of population). • GDP measures the total output produced within a country's borders - whether produced by that country's own firms or not.
Projection of Future Trends • Malthus ( 1798) exponential human population growth will surpass the arithmetic growth of food sources
Projection of Future Trends • Ehrlich (1968) The Population Bomb discussed famine and economic state so poor in the 70s and 80s that hundreds of millions would starve to death • Improvements to food technology and potable water staved this off. • Ehrlich (1990) The Population Explosion discussed that unsustainable use of the earth will lead to its collapse. • Sanderson (2007) World population will stabilize in 2070 at 9 billion and then start to decline • Are we stretching our carrying capacity beyond a sustainable level?
Life Support Systems: Food & Soil – 15.3 • 1900 one farmer could produce enough to feed seven people • Today one farmer could produce enough to feed one hundred people • 1950s-mid-1980s increases in food production outpaced increases in demand however more recently global food production has leveled off.
Life Support Systems: Food & Soil • Average daily intake should be no less than 9900 J or 2365 cal. Below this chronic malnutrition may result. Almost 500 million people regularly consume less that the minimum critical diet. • Interesting Note: malnutrition can be undernourishment or overnourishment (coronary heart disease and obesity prevalence in North America and Europe). • Key Points • Arable land land capable of being used for the purpose of cultivating crops • Poverty prevents the poor from buying food, regardless of how much might be available
Food Sources • Ocean Fisheries • Consumption peaked in 1989 with no increase until 2030 due to pollution, habitat damage and overharvesting • Livestock • Consumption has increased dramatically. 44 million tonnes (1000 kg) produced in 1950 to 211 million tonnesin 1997. • 36% of world’s grain goes to feed livestock, if it were reduced by 10%, 67 million tones of grain could sustain 225 million people. • Forestry issues in central and south America; water scarcity in northern China, middle east, northern India and sub-Saharan Africa; wastes have lead to toxic algal blooms and loss of fish species
Food Sources • Grains • 631 million tonnesin 1950 to 1780 million tonnesin 1990 (similar to livestock expansion). • Trend will slow though due to loss of land • Housing more regions being used to live in contrast to being used to feed people • Soil Degradation removal of soil nutrients from topsoil due to erosion by water and wind • Salinization accumulation of excess salts in soil that restricts the amount of water and essential nutrients plants can withdraw from the soil
Energy Distribution & Sustainable Food Production • Energy Pyramids demonstrates energy flow from producers along food chains • Humans can obtain more energy from consuming producing organisms (grains) rather than feeding them to livestock as energy gets inefficiently passed along food chains.
Life Support Systems: Water & Air – 15.4 • Urban sprawl leading to damage of aquifers • Aquifer porous, water saturated layers of sand, gravel and rock that can store and yield significant volumes of water; precipitation and run off enter recharge zones and percolate gradually down to an aquifer.
Water Resources & Problems • Water is arguably the world’s most precious resource however it is the planet’s most poorly managed. • Walkerton 2001, E. coli 0157:H7, killed seven and infected 2300 • Supply and Demand • Worldwide of all diverted water, 70% is used to irrigate, 20% is used by industry, 10% is used by residents in cities • Glacier disappearance? South Saskatchewan River may last another 200 years, 50-90% of Swiss glaciers could be gone by the end of the 21st century • Falling water tables as wells run dry Grey and Bruce counties in Ontario and in areas where bottling of water is permitted by companies.
Water Resources & Problems • Answers? • Improved methods of flood irrigation • Using wells instead of creating damns, lining ditches to reduce water loss, holding ponds to store rainfall, recapture of unused irrigation water, computer monitoring of soil moisture levels; sprinkler or drip systems • Salination salt used on roads affects plants, animals, birds, lakes, sediment and groundwater • Use of salt water for humans via desalinization: distillation or reverse osmosis
Threats to the Atmosphere • Air pollution leads to acid deposition (sulfuric and nitric acids) • Acid deposition results in changes in pH of soil which can lead to: • Essential soil nutrients such as calcium and magnesium salts, leach from the soil reducing plant productivity and the chemical buffering activity of the soil • Aluminum ions can be released impeding uptake and transport of nutrients such as N, K and P from soil water to the roots of plants
Threats to the Atmosphere • Trees and plants can become weakened from these process leaving them susceptible to disease • The dissolving of insoluble soil compounds is promoted releasing lead, cadmium and mercury ions that are highly toxic to plants and animals. • Acid deposition also alters the pH of aquatic systems, reducing fish populations through acid stress or impeding reproduction
Restoration Ecology and Waste Management – 15.5 • Increased quality of life has meant increased consumerism for many (especially North America). What effect is this having on the carrying capacity?
Monitoring Carrying Capacity are we affecting the threshold? • Baseline data initial information about both abiotic and biotic factors of an ecosystem that can be used to monitor changes in an ecosystem. • Indicators are things that can be measured to determine changes to baseline data and in some cases indicator species provide valuable insight as to what is happening to an ecosystem (frogs) • Ecological footprint Rees and Wackernagel in the 1990s • Toronto has an area of 7061km2 however it requires 323 192km2 to obtain resources and assimilate wastes based on its population footprint (30% of Ontario) • Footprint Wackernagel
Restoring Degraded Ecosystems • “Sustainable development can be achieved, but only if irreversible degradation of the environment can be halted in time” US National Academy of Sciences and the Royal Society of London (1992; Nobel laureates) • Restoration ecology applies ecological principles to repair, renew or reconstruct degraded systems • Bioremediation use of organisms, usually bacteria, to detoxify polluted environments such as oil spills and contaminated soils. Often recombinant DNA is used in Pseudomonas bacteria
Bioremediation in Action • Trichloroethene (TCE) and tetrachloroethene (perchlorothylene (PCE) are suspected carcinogens • Volatile liquids at room temperature and seep into the ground and cling to soil difficult to clean up • 1997 Dehalococcodies ethenogenes Strain 195 respire chlorinated hydrocarbons and convert to ethane gas • Key here is that all 4 chlorines are being removed as all precursors along the way of degradation are either known or suspected carcinogens. H reacts with Cl to form HCl which reacts with metal ions to form harmless salts.
Waste: The Legacy of Consumption • The main source of water and air pollutants is the disposal of waste • Household, commercial and industrial byproducts have increased in our consumer society adding stress to all parts of the Earth. • Biodegradation natural cycling of wastes by organisms, mainly bacteria; used extensively before 1920 • Up to the 1960s wastes dumped into marshlands which were thought to be wastelands • Dumps have been analyzed and the key to degradation is that products that will break down have to be in contact with water to do so. No sunlight or oxygen and high temperatures are key for anaerobic bacteria but without water items that could break down, will not.
Limiting Wastes • Ways to deal with global pollution: • Prevent, reduce or eliminate production of pollutants using alternatives • Clean up those pollutants that we do use • High Throughput Economy • Economic growth is sustained by moving resources into the economy • Resources become wastes and pollution and do not support sustainability • Recycling can help this however it is only a partial solution
Limiting Wastes • Low Throughput Economy • Reducing consumption, reusing and recycling nonrenewable resources, making efficient use of energy sources, pollution prevention and reducing waste production
Common Future – 15.6 • Tracking what is happening on the Earth globally is something that only humans can do. • Cumulative effects accumulated changes to natural environments caused by several interactions, factors or changing conditions • Potential Ecological Effects p. 741, table 1
Common Future • Cumulative Effect Example Mexico City • Water city built on bed of a drained lake in the 16th century . The spongy clay of the lakebed has not been able to support the weight of the developing city. As a result the city is sinking in unison with the groundwater below the city being consumed. • Rerouting water by any means however the aquifer is being tapped and forests used to replenish the aquifer are now gone. Decades left?
Common Future • Waste no place to put the waste. Fecal dust leading to salmonella and hepatitis infections. Water pollution is believed to cause 100 000 premature deaths per year. • Earthquakes structural and development issues surrounding being ready to accommodate earthquakes • Air Pollution serious problem in Mexico City. Mexico City is also infamous for its air pollution. In 1992, the United Nations described the city's air as the most polluted on the planet. Six years later, that air earned Mexico the reputation of "the most dangerous city in the world for children." Despite more than a decade of stringent pollution-control measures, a dull haze hangs over the city most days, obscuring the stunning snow-capped mountains that frame the city and endangering the health of its inhabitants.
Common Future • Systems Thinking the analysis of problems that focuses on the implications for an entire system rather than on the implications for individual component parts of the system.