Download
1 / 22
220 likes | 370 Vues
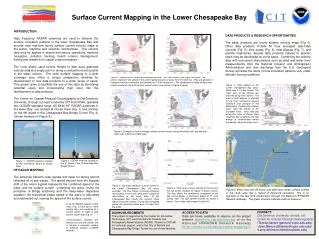
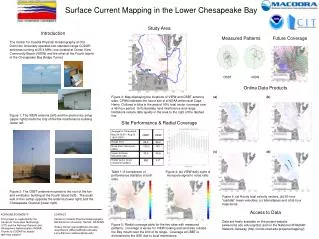
Surface Current Mapping in the Lower Chesapeake Bay. Larry Atkinson Teresa Garner Jose Blanco. Two sites - one at Norfolk City beach and one at Bay Bridge Tunnel Island #4. The whole lower Bay is covered. An additional NOAA site at CPHN will provide coverage offshore and redundancy inshore.

E N D
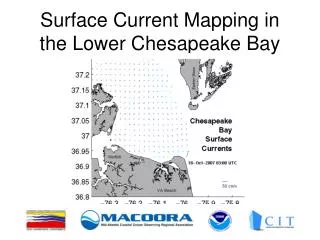
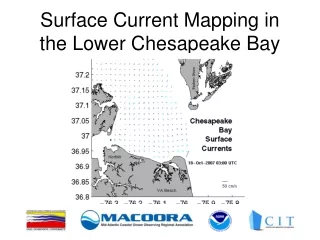
Surface Current Mapping in the Lower Chesapeake Bay Larry Atkinson Teresa Garner Jose Blanco
Two sites - one at Norfolk City beach and one at Bay Bridge Tunnel Island #4
The whole lower Bay is covered. An additional NOAA site at CPHN will provide coverage offshore and redundancy inshore The whole lower Bay is covered. Addition of a NOAA site at CPHN will provide coverage offshore and redunancy inside
Initial Products - Hourly vectors, 50 hour subtidal means, tidal ellipses, 6 hour trajectory
Measured and Ideal Beam Patterns View – On Beach CBBT – on Island Ideal
Baseline comparisons improved significantly using the measured beam patterns
The radial speed should be the same from each antenna at the middle of the baseline.
NOAA PORTS has 3 ADCP’s on Coast Guard ATON buoys in the area CPHN
Time series of absolute speed for hourly averaged NOAA ADCP data (blue) and CODAR data (red) and their difference (black line).
Means and standard deviations of the speed differences (absolute value of ADCP data – CODAR data).
Product development for specific users – Navigation channels, sewage effluent, Navy special ops.
Wave and wave steepness – NWS and Weatherflow. CODAR wave product to be tested with NOAA/NWS and Weatherflow. Probably only good during southward winds.
Future work • We plan to tow an ADCP for further data comparisons focusing on key areas where we will collect data within a few radial footprints for at least four hours to compare with radials. • Other comparisons will be possible using ADCP transects from routine monthly Bay Mouth cruises.
Comments • ROW-G is critical to success of this RESEARCH to OPERATIONS program • Creating products users can use is critical – this is usually not a vector map.
Contacts and Information Project website: www.lions.odu.edu/org/cbc National HFRADAR Network Gateway: http://cordc.ucsd.edu/projects/mapping Center for Coastal Physical Oceanography, Old Dominion University, Norfolk, VA 23529 Teresa Garner (garner@ccpo.odu.edu) Jose Blanco (jlblanco@ccpo.odu.edu) Larry Atkinson (latkinso@odu.edu)
References • Lipa, B.J., B.Nyden, D.S. Ullman, and E. Terrill, “SeaSonde Radial Velocities: Derivation and Internal Consistency,” IEEE J. Ocean. Eng.,vol. 31, no.4, pp. 850-861, Oct. 2006. • NOAA Ocean Systems Test and Evaluation Program (OSTEP), "Test, Evaluation, and Implementation of Current Measurement Systems on Aids-To-Navigation", NOAA Technical Report NOS CO-OPS 043, Silver Spring, MD, 2005. • Yoshikawa,Y., A. Masuda, K. Marubayashi, M. Ishibashi, and A Okuno, “On the accuracy of HF radar measurement in the Tsushima Strait,” J. Geophys. Res., 111, C04009, doi:10.1029/2005JC003232.