Download

1 / 45
450 likes | 602 Vues
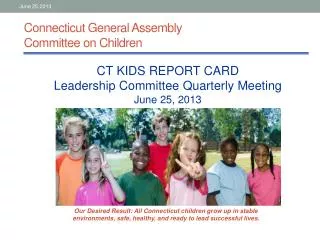
Connecticut General Assembly Committee on Children. CT KIDS REPORT CARD Leadership Committee Quarterly Meeting June 25, 2013. Our Desired Result: All Connecticut children grow up in stable environments, safe, healthy, and ready to lead successful lives. Report Card Project: Current Status.

E N D
Connecticut General AssemblyCommittee on Children CT KIDS REPORT CARD Leadership Committee Quarterly Meeting June 25, 2013 Our Desired Result: All Connecticut children grow up in stable environments, safe, healthy, and ready to lead successful lives.
Report Card Project: Current Status • Significant progress in establishing data-informed accountability tool that can lead to better outcomes for all Connecticut kids as mandated by PA 11-109 • With broadly representative stakeholder working group, identified16 primary and 20 secondary report card indicators related to children’s stability, safety, health, and future success • Compiling trend data and building publicly accessible website; working draft of electronic report card with four headline indicators exists on-line • Establishing data development agenda and structures to sustain report card tool, oversee implementation of next steps (analyze trends, develop and monitor strategies and programs to achieve desired results)
New Developments • Leadership committee to help oversee report card implementation established, chaired by Lt. Governor and Graustein Exec. Director • Small group of individuals who head key partner agencies and organizations provides high-level input needed to set, steer, and monitor state’s course for achieving desired results • Meet quarterly to assess progress, advise children’s committee on priorities for action to “turn the curve” • Forming strategic action groups • Made up of stakeholders with direct knowledge and experience (top agency managers, program administrators, community representatives, advocates); appointed by leadership committee • Will identify and assess current initiatives as well as possible new approaches to improve children’s stability, safety, health, and future success • Help organize interdisciplinary project teams to manage specific programs or initiatives and report on performance measures
Ongoing Efforts • Update and expand current report card data • Volunteer effort with generous support from CTData.Org and Results Leadership Group • Get all indicators ready for public website • Expect headline indicators to go “live” during summer 2013 • Other primary and all secondary indicators in place by end of 2013 year • Disaggregated by relevant characteristics to extent available (race/ethnicity, age, gender, income, geography)
Primary Indicators* * CT Kids Report Card headline indicators listed first in bold
PA 11-109 also requires: • Children’s Committee, in consultation with the RBA subcommittee of Appropriations to: • Identify programs that make significant contributions to achieving the result that all Connecticut children grow up in stable environments, safe, healthy and ready to lead successful lives • Entities that administer such programs must prepare annual report cards using the format developed by the RBA subcommittee • Address the key RBA performance questions: How much did we do? How well did we do it? Is anyone better off? • Discuss “story behind the data” and propose actions to “turn the curve”
Potential “Drill Down” Programs • Initially, select one or two programs for each domain, involving different subpopulations and administering agencies, for example: • Stable – programs to reduce chronic absenteeism/improve school attendance like Judicial Branch’s Waterbury Truancy Court, municipal school arrest reduction initiatives, DCF supportive housing program • Safe – DCF’s Family Assessment (Differential) Response • Healthy – DPH School-Based Health Centers, Behavioral Health Services operated/funded through DCF, DPH, DSS • Future Success– selected SDE Achievement Gap/Alliance District programs and state-funded early childhood services • Use current Appropriations Committee report card format
What is the state of the State’s Children?Overview OF Headline Indicators CT Kids Report Cardwww.ctkidsreportcard.org
STABLE: Almost 15% of School-Age Children in Connecticut were Chronically Absent in 2011
Chronic absenteeism rates much higher among Black and Hispanic Students
Low income students (defined as those eligible for free lunch) more likely to be chronically absent
Latest Indicator Data • SDE Chronic Absenteeism data for 2011-12 available (and can be accessed at CTData.Org) • Statewide rate 11.0% overall, with Black students 15.2%, Hispanic students 18.4%, White students 8.0% • Rates substantially higher in urban districts and among English language learners and students with disabilities as well as for students eligible for free lunch • Department still examining reasons for large drop from prior years • May be related to data quality/data collection problem
Suggested Action Steps • Strategic priorities for addressing chronic absenteeism: • Family engagement initiatives • Wraparound services - school, family, community partnerships • Access to health and mental health resources (asthma management, oral health care, behavioral health care) • Key action group members: • SDE top managers for attendance/absenteeism efforts, representatives from Discovery Community/Campaign for Grade Level Reading, Youth Service Bureaus, Alliance Districts with wraparound service plans, truancy courts, True Colors, CT Juvenile Justice Alliance, Hartford Foundation for Public Giving
HEALTHY: In recent years, just under 6% of babies were born with low birth weights
In 2010, the rate of low birth weight babies for Black mothers was more than twice that of White mothers
Latest Indicator Data • 2010 remains most recent available DPH data • Lag time of crucial health data a challenge • Impedes ability turn the curve • Limits understanding of the impact of interventions • Preliminary statistics could be considered
Suggested Action Steps • Strategic priorities for addressing low birth weight: • Culturally competent maternal education for prenatal care including risks of smoking • Access to quality prenatal care, smoking cessation programs • Another health priority: • Education for parents and children about asthma management, community prevention and early intervention services (to reduce emergent and urgent care visits, improve school attendance) • Key action group members: • Top managers from DPH (e.g., infant and maternal health, asthma initiatives, SBHCs), DCF medical director and other child and adolescent health professionals, managers from CHDI, UConn Public Health Research institute and other health research organizations
FUTURE SUCCESS: Almost 60 percent of 3rd graders were reading at or above grade level in 2011
However, disaggregated data clearly show the state’s achievement gap; the portion of Black and Hispanic 3rd graders at or above goal is half that of White and Asian students
Similar gap in achievement is revealed for low income students (defined as eligible for free/reduced lunch)
Latest Indicator Data • SDE 3rd Grade Reading Level data available for 2012 indicates: • A slight uptick to 59.2% of third graders reading at or above grade level • Rates continue to be substantially lower in urban districts and achievement gaps persist for minority students, English language learners and students with disabilities as well as for students eligible for free lunch • Department suppression policies limit availability of disaggregated district level information
Suggested Action Steps • Strategic priorities for improving 3rd graders’ reading level: • School, family, and community partnerships to promote engagement, support for education • Early childhood education initiatives • Key action group members: • Interagency Council for Ending the Achievement Gap, Early Childhood Cabinet, representatives of Discovery Communities, parent, teacher, and school administrator groups, education researchers
Mission Statement Insurance & Real Estate Search Statutes House Streaming Video Basic Legislative Document Search Journals Journals Abbreviations & Acronyms Capitol Picture Book (pdf) Aging Bulletins Fiscal Analysis Connecticut General Statutes By Committee New From OLR Proposed Bill Request System By Committee 2005 to 2007 Reference Tables Connecticut General Statutes African American Affairs Land Conveyance Form Committees A - H & I - Z Broadcast Media Commissions Staff Offices Statutes About OLR SAFE: Substantiated abuse and neglect cases occurred at rate of about 11 per 1,000 children (birth to age 18) in 2011 Select Committee on Children: RBA Report Card Working GroupCT Kids Report Card - SAFE When viewing the report card, click on the measure to see the detail on "Turning the Curve". When you are finished viewing, click the X in the upper right hand corner of the screen.
Neglect is much more prevalent than abuse, underscoring the need for effective ways to support and strengthen families
Latest Indicator Data • DCF child abuse and neglect data are available for 2012: • Statewide overall rate declined to 10.37 overal, with abuse only 0.67 and neglect only 9.10 (ages 0 through 17) • Department suppression policies limit availability of town-level disaggregated data • Changing definitions complicate analysis of trends
Suggested Action Steps • Strategic priorities for keeping kids safe from abuse and neglect: • Initiatives to strengthen and support families including supportive housing, behavioral health treatment services • State agency, community, and family partnerships • Key action group members: • DCF top managers, Office of Child Advocate, representatives of community service providers, Discovery communities, parent groups, mandated reporters, schools, pediatricians and other children’s health professionals, advocates (e.g., Center for Children’s Advocacy, FAVOR, CAFAP,), researchers (e.g., CHDI)
Connecting Population Indicators to Program Performance Measures Implementing RBA at the Department of Children and Families
RBA Operational Assumptions • No one program or agency can be held solely responsible for large systems change. • Funders and providers are partners in this work, holding complementary and interdependent roles. • The lack of desired outcomes does not necessarily mean a program, a provider, or a service type has failed; it just may be the story behind the data must be better understood in order to inform what steps to take next. • Funders, public and private agencies, and community providers are all on the same team, working to achieve the same outcomes for the clients they serve. • Less than optimal results will be used first to inform, rather than to punish.
Key Components of DCF’s RBA Implementation Leadership Commitment Strategic Plan Staff Training Provider Outreach Ongoing Education and Awareness Development of RBA Contract Performance Measures Use of performance data and client outcomes to manage services Participation in inter-agency efforts
THE LINKAGE Between POPULATION and PERFORMANCE POPULATION ACCOUNTABILITY Healthy BirthsRate of low birth-weight babiesChildren are SafeRate of child abuse and neglectChildren Ready for Future SuccessPercent fully ready per K-entry assessment PERFORMANCE ACCOUNTABILITY Child Welfare Program POPULATIONRESULTS Contributionrelationship Alignmentof measures Child Welfare Program # offamilies served by community provider agencies % of identified needs met Appropriateresponsibility # of families with new reports to Careline % of families with new reports to Careline CUSTOMERRESULTS Adapted from Mark Friedman: RBA101
Connecticut’s Children live in stable environments, are safe, healthy, and ready for future success Strategy #2. Apply strength-based, family-centered policy, practice and programs agency-wide 2.1 Fully implement Child and Family Teaming 2.2 Support and evaluate the DCF Family Assessment Response (FAR) 2.3 Assure sibling connections 2.4 Expand and support kinship foster family care 2.5 Expand the DCF Fatherhood Initiative 2.6 Meet Juan F. Consent Decree case planning requirements
FAR: Is anyone better off? April 2012 through December 2012 (Preliminary Data)
DCF Strategic Plan • Strategic Plan developed using RBA • Aligned with CTKids Report Card and Cross-Agency Results Statements • Nine Strategies • Increase investment in prevention and health promotion • Apply strength-based, family-centered policy, practice and supports agency-wide • Develop or expand regional networks of in-home and community services • Congregate rightsizing and redesign • Address the needs of specific populations • Support collaborative partnerships with communities and other state agencies • Support the public and private sector workforce • Increase the capacity of DCF to manage change and ongoing operations • Improve revenue maximization and develop reinvestment priorities and methods
Community Based Services Outcomes Committee (CBSO) • Developed to improve system efficiency, accountability and outcomes for children and families • Develops, enhances, and monitors standard performance measures and client-based outcomes for all purchased services • Meets regularly to ensure ongoing and systematic progress in developing contract performance measures, and to develop and support the role of DCF program leads
Community Based Services Outcomes Committee (CBSO) • “Outcomes” catalogued and characterized into approximately 20 categories for all 70 service types • Analysis of outcomes and categories as RBA performance measures versus • Program/model requirements • Contract compliance issues • RBA Performance Measure Pilot Project: • 10 program types • RBA performance measures developed through contract amendments, re-procurement, re-design
RBA Performance Measure Development • Creation of performance measure development worksheet • Review types of monitoring and performance measures • Review RBA performance measure types • Categorization of existing contract outcomes • Process to develop new RBA performance measures with a focus on client outcomes • Proposed RBA performance measures by type • Meet with program leads for training and TA • Program leads work with provider groups to develop proposed performance measures • Meet to review and revise (if necessary)
RBA Performance Measure Development • Develop proposed performance measures: • How much did we do? • How well did we do it? • Is anyone better off? • Develop items for exclusion: • What can providers stop reporting? • Model components or contract compliance items that should not be confused with outcomes • Identification of data sources • Who will collect the data, and how? • Who will report the data; how and how often? • Who will analyze the data, and how will it be used?
Ongoing workplan to include RBA performance measures in all contracts • System-Wide Implementation • All New Programs • All Re-designed Programs • All Re-procured Programs • All Contracts through prioritized schedule
Lessons Learned • Know how you will utilize performance measures and outcome data • Identify data sources and who will collect data • Use performance measures and outcomes to manage contracts • Use data to understand program performance • Don’t be surprised by your RBA Report Card • Program Leads • The CBSO supports the work of program leads in their oversight and collaboration roles
Jump in!! Nothing will ever be attempted if all possible objections must first be overcome Samuel Johnson 1709 – 1784, British Author