Download
1 / 50
510 likes | 520 Vues
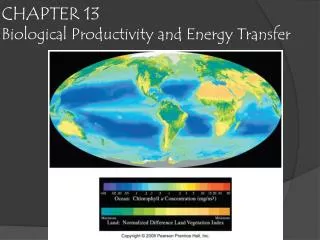
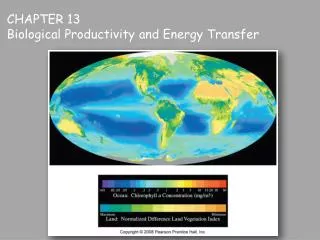
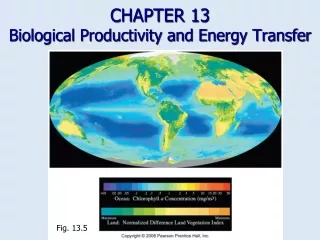
CHAPTER 13 Biological Productivity and Energy Transfer. Fig. 13.5. Primary productivity. Energy is converted into organic matter to be used by cells Photosynthesis using solar radiation 99.9% of marine life relies directly or indirectly on photosynthesis for food

E N D
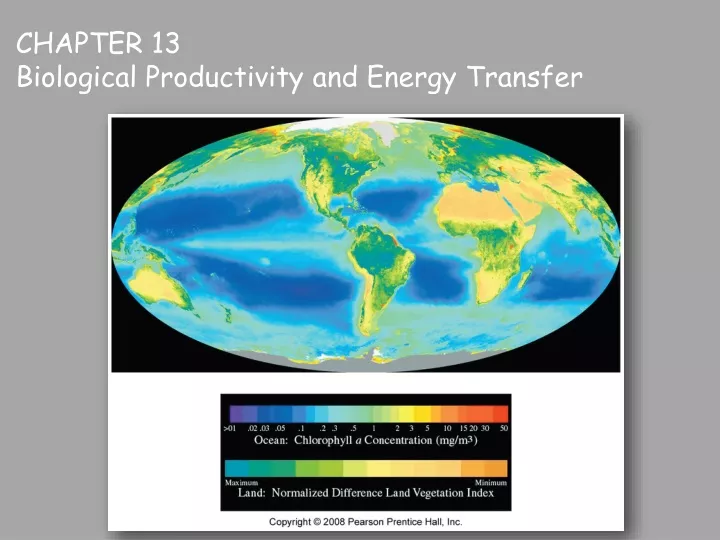
CHAPTER 13Biological Productivity and Energy Transfer Fig. 13.5
Primary productivity • Energy is converted into organic matter to be used by cells • Photosynthesis using solar radiation • 99.9% of marine life relies directly or indirectly on photosynthesis for food • Chemosynthesis using chemical reactions • Happens in hydrothermal vents at bottom of ocean with no light
Let’s talk about energy • Biological organisms need biochemical processes to happen in an orderly fashion in order to maintain life • Needs constant input of energy to maintain that order • Our cells need energy in form of ATP • ATP formed during cellular respiration • Need input of carbon (i.e. glucose) and oxygen for cellular respiration • That carbon source and oxygen comes from photosynthesis (primary productivity)
Photosynthetic productivity • Chemical reaction that stores solar energy in organic molecules • Photosynthetic organisms fix carbon and energy from atmosphere • Also incorporate other elements and molecules necessary for life (nitrogen, phosphorus, etc) • What do we need these for? For making proteins, lipids, DNA, etc. • Use some of that for their own energy source for life • Rest moves it’s way up the food chain
Measuring primary productivity • Capture plankton • Plankton nets • Ocean color • Chlorophyll colors seawater • SeaWiFs on satellite
Factors affecting primary productivity • Nutrients • Nitrate, phosphorous, iron, silica • Needed for bacteria and phytoplankton to make more DNA, proteins, etc to make more of themselves • Most from river runoff • Productivity high along continental margins • Solar radiation • Uppermost surface seawater and shallow seafloor are most productive, need light! • Euphotic zone surface to about 100 m (330 ft)
Upwelling and nutrient supply • Cooler, deeper seawater nutrient-rich • Areas of coastal upwelling sites of high productivity Fig. 13.6a http://cordellbank.noaa.gov/images/environment/upwelling_470.jpg
Light transmission • Visible light of the electromagnetic spectrum • Blue wavelengths penetrate deepest • Longer wavelengths (red, orange) absorbed first
Light transmission in ocean • Color of ocean ranges from deep blue to yellow-green • Factors • Water depth • Turbidity from runoff • Photosynthetic pigment (chlorophyll) • “dirty” water in coastal areas, lagoons, etc. are areas of high productivity, lots of plankton (preventing that “blue” color) http://upload.wikimedia.org/wikipedia/commons/a/a5/LightningVolt_Deep_Blue_Sea.jpg
Types of photosynthetic marine organisms • Anthophyta • Seed-bearing plants, example is mangroves • Macroscopic (large) algae • Larger seaweeds, like kelp • Microscopic (small) algae • phytoplankton • Photosynthetic bacteria
Anthophyta • Only in shallow coastal waters • Primarily seagrasses & Mangroves • Very few plant species can tolerate salt water http://celebrating200years.noaa.gov/events/sanctuaries/seagrass_meadow650.jpg
Macroscopic algae – “Seaweeds” • Brown algae http://www.starfish.ch/photos/plants-Pflanzen/Sargassum.jpg
Macroscopic algae – “Seaweeds” • Green algae Caulerpa brachypus, an invasive species in the Indian River Lagoon Codium http://www.sms.si.edu/IRLspec/images/cbrachypus2.jpg http://192.107.66.195/Buoy/System_Description_Codium_Fragile.jpg
Macroscopic algae – “Seaweeds” • Red algae • Most abundant and most widespread of “seaweeds” • Varied colors http://www.agen.ufl.edu/~chyn/age2062/lect/lect_15/22_14B.GIF http://www.dnrec.state.de.us/MacroAlgae/information/Indentifying.shtml
Microscopic algae http://biologi.uio.no/akv/forskning/mbot/images • Produce food for 99% of marine animals • Most planktonic • Golden algae • Diatoms(tests of silica) • Most abundant single-celled algae – 5600+ spp. • Silicate skeletons – pillbox or rod-shaped ooze • Some w/ sticky threads, spines slows sinking www.bren.ucsb.edu/ facilities/MEIAF
Microscopic algae • Coccolithophores(plates of ate) • Flagellated • calcium carbon plates possibly sunshades • Coccolithid ooze fossilized in white cliffs of Dover http://www.esa.int/images
Microscopic algae • Dinoflagellates • Mostly autotrophic; some heterotrophic or both • Flagella in grooves for locomotion • Many bioluminescent • Often toxic when toxin is concentrated due to bloom • Red tides (algal blooms) fish kills (increase nutrients, runoff) http://oceanworld.tamu.edu/students/fisheries/images/red_tide_bloom_1.jpg http://www.hku.hk/ecology/porcupine/por24gif/Karenia-digitata.jpg
Manatees died in Brevard and Volusia counties in 2007, and on west coast, possibly due to red tide • concentrates on seagrass manatees eat • Breath in toxic fumes http://www.nepa.gov.jm/yourenv/biodiversity/Species/gifs/manatee.jpg
Microscopic algae • Dinoflagellates • Pfiesteriafound in temperate coastal waters • Ciguatera - illness caused from eating fish coated with Gambierdiscustoxicus • Paralytic, diarhetic, amnesic shellfish poisoning Pfiesteria http://www.odu.edu/sci/biology/pfiesteria
Photosynthetic bacteria • Extremely small • May be responsible for half of total photosynthetic biomass in oceans Anabaena Gleocapsa http://www.micrographia.com/specbiol/bacteri/bacter/bact0200/anabae03.jpg http://silicasecchidisk.conncoll.edu/Pics/Other%20Algae/Blue_Green%20jpegs/Gloeocapsa_Key45.jpg
Regional primary productivity • Varies from very low to very high depending on • Distribution of nutrients • Seasonal changes in solar radiation • About 90% of surface biomass decomposed in surface ocean • About 10% sinks to deeper ocean • Only 1% organic matter not decomposed in deep ocean reaches bottom • Biological pump (CO2 and nutrients to sea floor sediments)
Table 13.1 = 4785 Smaller than land but this is by meter2 (think about how large ocean is compared to land) = 6450
Temperate ocean productivity • Seasonal variation with temperature/light/nutrients • Winter: • High winter winds mixing of sediments/plankton • Low light & few phytoplankton nutrients increase • Spring: • Phytoplankton blooms with more light, nutrients • Bloom continues until… • Nutrients run out • Herbivores eat enough phytoplankton • Summer: often low production due to lack of nutrients • Fall: Often second bloom, as winds bring up nutrients
Polar ocean productivity • Winter darkness • Summer sunlight (sometimes 24 hours/day) • Phytoplankton (diatoms) bloom • Zooplankton (mainly small crustaceans) productivity follows • HIGH PRODUCTIVITY!! • Example Arctic Ocean
Polar ocean productivity • Availability of sunlight during summer and • High nutrients due to upwelling of North Atlantic Deep Water • No thermocline • No barrier to vertical mixing • Blue whales migrate to feed on maximum zooplankton productivity
Tropical ocean productivity • Permanent thermocline is barrier to vertical mixing • Low rate primary productivity (lack of nutrients) above thermocline • That’s why tropical waters tend to be clear and blue
Tropical ocean productivity • Productivity in tropical ocean is lower than that of polar oceans • That’s why tropical oceans look clear • Tropical oceans are deserts with some high areas of sporadic productivity (oasis) • Equatorial upwelling • Coastal upwelling (river runoff, etc.) • Coral reefs
Energy flow in marine ecosystems • Consumers eat other organisms • Herbivores (primary consumers) • Carnivores • Omnivores • Bacteriovores • Decomposers breaking down dead organisms or waste products
Nutrient flow in marine ecosystems • Nutrients cycled from one chemical form to another • Biogeochemical cycling • Example, nutrients fixed by producers • Passed onto consumers • Some nutrients released to seawater through decomposers • Nutrients can be recycled through upwelling
Feeding strategies • Suspension feeding or filter feeding • Take in seawater and filter out usable organic matter • Deposit feeding • Take in detritus and sediment and extract usable organic matter • Carnivorous feeding • Organisms capture and eat other animals
Trophic levels • Feeding stage is trophic level • Chemical energy is transferred from producers to consumers • On average, about 10% of energy is transferred to next trophic level • Much of the energy is lost as heat Fig. 13-18
Food chain Food web • Branching network of many consumers • Consumers more likely to survive with alternative food sources • Primary producer • Herbivore • One or more carnivores
Foodwebs are more complex & more realistic • Consumers often operate at two or more levels http://users.aber.ac.uk/pmm1
Biomass pyramid • Both number of individuals and total biomass (weight) decrease at successive trophic levels • Organisms increase in size
Symbiosis • Organisms associate in beneficial relationship • Commensalism • One benefits without harm to other • Mutualism • Mutually beneficial • Parasitism • One benefits and may harm the other
Marine fisheries • Commercial fishing • Most tonnage from continental shelves and coastal fisheries, compared to open ocean fisheries • Over 20% of catch from areas of upwelling that make up 0.1% of ocean surface area Fig. 13.23
Overfishing • Taking more fish than is sustainable over long periods • Remaining fish younger, smaller • About 30% of fish stocks depleted or overfished • About 47% fished at biological limit
Aquaculture becoming a more significant component of world fisheries
Incidental catch or bycatch • Bycatch - Non-commercial species (or juveniles of commercial species) taken incidentally by commercial fishers • Bycatch may be 25% or 800% of commercial fish • Birds, turtles, dolphins, sharks http://www.motherjones.com/news/featurex/2006/03/bycatch_265x181.jpg
Incidental catch or bycatch • Technology to help reduce bycatch • Dolphin-safe tuna • TEDs – turtle exclusion devices • Driftnets or gill nets banned in 1989 • Gill nets banned in Florida by constitutional amendment in 1994 http://www.st.nmfs.noaa.gov/st4/images/TurtTEDBlu_small.jpg
http://www.cefas.co.uk/media/70062/fig10b.gif Fisheries management Plaice • Regulate fishing • Closings – Cod fisheries of New England • Seasons • Size limits • Minimum size limits –protects juveniles, less effective • Min/max size (slot) limits – preserves juvs and larger adults (contribute most reproductive effort) http://www.cefas.co.uk/media/70037/fig7b.gif
Fisheries management • Conflicting interests • Conservation vs. economic – “tragedy of the commons” • Self-sustaining marine ecosystems • Human employment • International waters • Enforcement difficult “Tragedy of the commons” – All participants must agree to conserve the commons, but any one can force the destruction of the commons http://farm1.static.flickr.com/178/380993834_09864a282c.jpg
Fisheries management • Governments subsidize fishing • Many large fishing vessels – often purchased with economic stimulus loans • 1995 world fishing fleet spent $124 billion to catch $70 billion worth of fish Activists deploying a banner reading, 'No Fish No Future' next to tuna fishing vessel Albatun Tre, which they claim is the world's largest tuna fishing vessel http://www.telegraph.co.uk/earth/main.jhtml?xml=/earth/2008/05/30/eatuna130.xml
Fisheries management • Northwest Atlantic Fisheries such as Grand Banks and Georges Bank • Canada and U.S. restrict fishing and enforce bans • Some fish stocks in North Atlantic rebounding • Other fish stocks still in decline (e.g., cod)
Fisheries management • Consumer choices in seafood • Consume and purchase seafood from healthy, thriving fisheries • Examples, farmed seafood, Alaska salmon • Avoid overfished or depleted seafood • Examples, bluefin tuna, shark, shrimp, swordfish • Visit: ORCA's Blue Diet page http://marineresearch.ca/hawaii/wp-content/uploads/tuna-auction-largeview.jpg